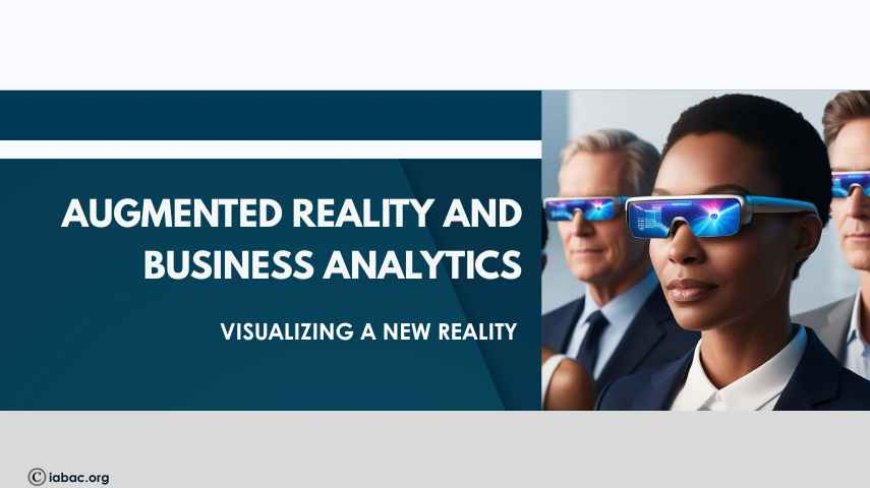
Augmented Reality and Business Analytics: Visualizing a New Reality
Business analytics is improving supply chains by enabling better forecasting, smarter decisions, and operational efficiency for stronger results.
Data is everywhere. Every day, businesses collect a huge amount of information — from sales numbers and customer choices to stock levels and employee performance. But collecting data is only the start. The real challenge is understanding what the data tells us and how to use it to make better decisions.
Two technologies are helping businesses do this in new ways: Augmented Reality (AR) and Augmented Analytics. They work differently but can complement each other to make data easier to understand, quicker to act on, and more useful for everyone in a company. This article will explain both technologies, how they help businesses, examples of their use, and how you can start using them. It’s written in simple, easy-to-read words for anyone learning about Business Analytics or considering Business Analytics Certifications.
What Is Augmented Reality (AR) in Business Analytics?

Augmented Reality (AR) is technology that puts digital information on top of the real world. You can see it through AR glasses, a tablet, or a phone. For example, instead of looking at a flat chart on your computer, you could see a 3D chart hovering over a desk or a factory machine.
In business analytics, AR helps people see and understand data in a way that feels natural. Instead of reading numbers in a spreadsheet, you can interact with the data around you.
How AR Helps Businesses
-
Visualizing Data: AR makes data easier to understand. For example, a manager could see 3D sales charts floating over a map of the store or the city. This makes it easy to spot which products or areas are performing well.
-
Training Employees: Companies use AR for practice. A factory worker can learn how to fix machines with step-by-step instructions shown on the machine itself. A healthcare worker can practice procedures in a safe, virtual environment before working on real patients.
-
Making Decisions Faster: AR can show data where it is needed. For example, in a warehouse, AR glasses could highlight which shelves need restocking or show stock levels. Managers can quickly make decisions without switching to another device.
-
Team Collaboration: Teams can see the same AR data in a meeting room or remotely. They can discuss charts, rotate 3D graphs, and share ideas, making it easier for everyone to understand the information.
What Is Augmented Analytics?
While AR focuses on showing data clearly and interactively, Augmented Analytics focuses on helping people understand the data automatically. It uses computers to clean, analyze, and summarize data so that you don’t have to spend hours working through spreadsheets.
How Augmented Analytics Helps
-
Cleaning Data Automatically: Real-world data often has mistakes or missing information. Augmented analytics can clean and organize the data automatically.
-
Finding Important Patterns: The system can spot trends, changes, or unusual patterns without needing a person to manually look for them.
-
Answering Questions in Simple Language: You can ask questions like “Which products sold the most last month?” and get answers immediately, without knowing technical programming.
-
Explaining Results Clearly: Augmented analytics can provide easy-to-understand summaries of the data, explaining why certain numbers are important.
-
Predicting Future Outcomes: It can show what might happen next based on past data and even suggest actions to improve results.
-
Making Data Available for Everyone: Augmented analytics is not just for experts. It allows more employees to access and understand data, making decisions faster and more informed.
Examples of AR and Augmented Analytics
Here are some simple examples of how businesses use these tools today:
-
Retail Stores: Managers can see sales performance overlaid on the store layout, helping them plan stock and organize shelves.
-
Warehouses: Workers can see real-time inventory data through AR glasses, making it faster to pick items and reduce errors.
-
Manufacturing: Factory supervisors can monitor machines with AR, seeing which machines may need maintenance before they break down.
-
Healthcare: Trainees can practice procedures with AR overlays showing step-by-step guidance, while analytics tracks performance and progress.
-
Business Meetings: Teams can gather in a room or remotely and interact with 3D dashboards, making it easier to discuss strategies and make decisions.
Benefits of Using AR and Augmented Analytics
-
Understand Data Quickly: AR makes data visual and easy to grasp, while augmented analytics highlights important information automatically.
-
Make Faster Decisions: Real-time insights and interactive visualizations help managers act quickly.
-
Train Employees Effectively: Employees learn faster and perform tasks with fewer mistakes using AR and analytics.
-
Include Everyone in Decisions: You don’t need to be a data expert to use these tools. Everyone can understand and act on insights.
-
Reduce Errors: Automation helps reduce human mistakes and ensures consistent results.
-
Save Time and Money: Cleaning and analyzing data automatically saves hours of work and helps the business be more efficient.
How AR and Augmented Analytics Work Together
When AR and augmented analytics are combined, the result is powerful.
-
Visual Insights: Analytics finds patterns in the data, and AR shows them in a clear, interactive way.
-
Real-Time Decisions: For example, a warehouse worker can see insights from analytics overlaid on actual shelves. They know immediately which products to pick, where to restock, or which orders need priority.
-
Better Training: New employees can practice tasks in AR while analytics monitors their performance and provides feedback.
-
Team Collaboration: Teams can use AR to share interactive dashboards, while analytics provides accurate, easy-to-understand insights for discussion.
Challenges to Keep in Mind
Even though AR and augmented analytics are useful, businesses need to plan carefully:
-
Cost: AR devices and analytics tools can be expensive. Start with small projects to test the results.
-
Data Quality: The insights are only as good as the data. Ensure the data is accurate and complete.
-
User Training: Employees may need time to get comfortable with AR tools and AI-generated insights.
-
Privacy and Security: Make sure sensitive data is protected and access is controlled.
-
Integration: These tools should work well with your current systems to be effective.
Best Practices for Using AR and Augmented Analytics
-
Start Small: Test the tools in one department before rolling them out across the organization.
-
Focus on Important Tasks: Use AR and analytics where they can make the biggest difference, like operations, training, or customer service.
-
Clean Your Data: Make sure the data feeding analytics is accurate and organized.
-
Train Your Team: Provide simple training for employees to understand and use AR and analytics tools.
-
Collect Feedback: Ask employees how they use the tools and make improvements based on their suggestions.
-
Measure Results: Track improvements like faster decisions, reduced errors, and better employee performance.
The Future of AR and Augmented Analytics
As AR devices become cheaper and analytics tools get smarter, more businesses will use these technologies every day.
-
More Real-Time Data: Companies will see analytics results in real time through AR, helping them act faster.
-
Better Collaboration: Teams in different locations will meet in virtual AR rooms to discuss and explore data.
-
Industry-Specific Applications: Tools will be built specifically for retail, healthcare, manufacturing, and other industries.
-
Actionable Recommendations: Analytics will suggest actions and show outcomes in AR visualizations.
-
Focus on Trust and Transparency: Businesses will make sure analytics results are explained clearly and data is used responsibly.
Augmented Reality and Business Analytics: Visualizing a New Reality is changing the way businesses use data. AR makes information visual and easy to understand, while augmented analytics finds patterns, predicts outcomes, and explains insights automatically.
Together, they allow faster decisions, better training, more collaboration, and easier access to data for everyone. They are not meant to replace humans but to make it simpler to understand and use information. For anyone learning Business Analytics or exploring Business Analytics Certifications, understanding how AR and augmented analytics work together is essential. These tools are helping businesses see, understand, and act on data in smarter, simpler ways — making work easier, faster, and more effective.
IABAC Business Analytics is a great starting point for anyone who wants to learn more about these skills and prepare for a career in analytics.