


The Data science process
Understand the data science process, from data collection and cleaning to modeling and analysis, to extract valuable insights and drive informed decision-making
When I first started learning about data science, I quickly realized that the journey wasn't as random as it might seem. There’s a clear and organized path called the data science process that helps turn raw data into useful insights. From gathering data to building models and putting them into action, each step is important. Over time, I’ve learned that succeeding in data science is not just about having technical skills—it’s also about knowing how to deal with challenges, make smart decisions, and keep improving what you do. I’ll walk you through the data science process and share what I’ve learned to help you feel more confident in your data science journey.
What is the Data Science Process?
The data science process is the series of steps that data scientists use to turn raw data into useful information. It's all about analyzing data to solve problems or answer important questions, helping businesses and organizations make better decisions.
Here are the typical steps involved in the data science process:
- Understand the Problem: Identify what needs to be solved or answered.
- Collect Data: Gather the necessary data from different sources.
- Clean Data: Fix mistakes and organize the data for easy analysis.
- Explore Data: Look at the data to find patterns or important information.
- Build a Model: Use tools like machine learning to create a model that makes predictions.
- Evaluate the Model: Test how accurate and useful the model is.
- Share Results: Present the findings in reports or charts to help make decisions.
This is the core of the data science process—using data to solve problems and make better choices.

Modern Data Science Process
While the traditional steps are still important, today’s data science projects also include:
-
Feature Engineering & Transformation: Creating better inputs for models from raw data.
-
MLOps & Model Deployment Pipelines: Automating deployment, monitoring, and retraining of models.
- AI & Generative AI Integration: Using LLMs and AI tools to speed up analysis, automate insights, or generate predictions.
-
Responsible AI & Governance: Ensuring models are ethical, unbiased, and compliant with privacy regulations.
Adding these modern practices ensures models not only work but also remain accurate, scalable, and trustworthy in real-world applications.
What is an example of a data science process?
Data science is changing healthcare by helping doctors make better decisions and improve patient care. Wearable devices and sensors track important health data like heart rate and glucose levels, sending this information in real-time to healthcare systems. This helps doctors spot potential issues early. Predictive models also help identify patients at risk for conditions like diabetes, so they can be treated sooner. AI-powered assistants give personalized advice for managing long-term health problems. Data science also makes hospitals run more efficiently by predicting shortages of supplies, and ensuring critical medicines and equipment are always available. Overall, data science is improving the quality of care and saving lives. It’s an important tool in the healthcare data science process, and a Data Science certification can help professionals improve their skills in this area.
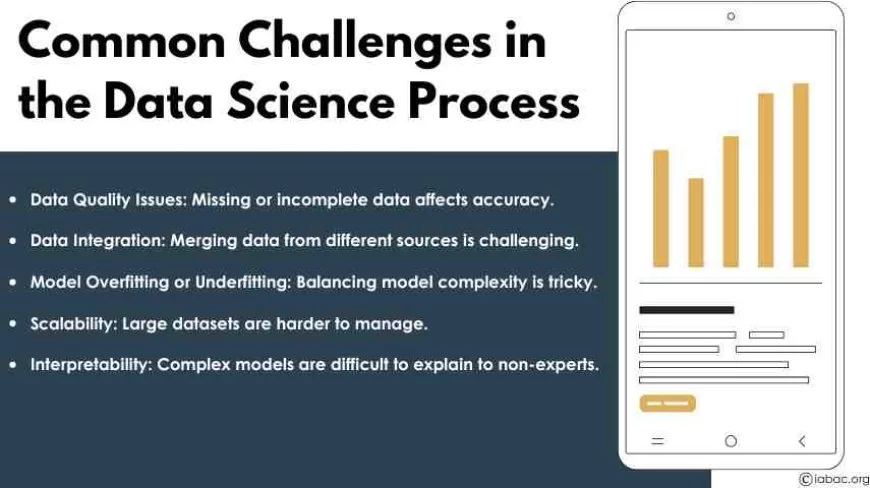
In the data science process, there are several common challenges that professionals face:
- Data Quality Issues: Missing or incomplete data can make analysis difficult and lead to inaccurate results.
- Data Integration: Combining data from different sources can be complicated and time-consuming, especially when the formats don't match.
- Model Overfitting or Underfitting: It's a challenge to create a model that is just right—not too complex (which can overfit) and not too simple (which can underfit).
- Scalability: As the amount of data grows, handling large datasets efficiently becomes more difficult.
- Interpretability: Complex models can be hard to explain, making it tough to communicate findings to people who don’t have a technical background.
- MLOps & Continuous Monitoring: Models can drift as new data arrives. Monitoring tools and automated retraining pipelines are essential to maintain performance.
- Ethical and Regulatory Challenges: Data privacy laws like GDPR or AI fairness requirements need to be considered before deployment.
These challenges highlight why a data science certification can be valuable, as it helps build the skills needed to overcome these common obstacles in the field.
What are the Key Stages of the Data Science Process

- Problem Definition: Start by understanding what problem you are trying to solve. What business challenge are you addressing? What outcome do you want to achieve? This first step sets the stage for the entire project.
- Data Collection: Gather data from different sources like databases, APIs, or surveys. The quality of the data you collect is very important because it directly impacts the accuracy of your results.
- Data Preparation: Clean and organize the data. This step involves fixing errors, dealing with missing information, and transforming the data into a format that’s ready for analysis.
- Exploratory Data Analysis (EDA): Explore the data to find patterns, trends, or relationships. This helps you get a better understanding of the dataset and guides your choice of the best approach for modeling.
- Modeling: Build models using different techniques like regression, classification, or clustering. You’ll test different models and adjust them to get the best results.
- Model Evaluation: Assess how well your model performs using metrics like accuracy, precision, or recall. It’s important to make sure the model can apply its predictions to new, unseen data.
- Deployment: Once you’re happy with the model’s performance, put it into action. This means deploying it into a system where it can provide real-time predictions or help with decision-making.
- Monitoring and Maintenance: Keep track of the model’s performance over time. As new data comes in, you may need to update or retrain the model to keep it accurate.
Tools & Technologies
While Python, R, and SQL remain foundational, modern data science projects increasingly use:
-
Data Analysis & ML: Pandas, NumPy, Scikit-learn, TensorFlow, PyTorchVisualisation
-
Visualization: Tableau, Power BI, Plotly, Seaborn
-
Cloud & Big Data: AWS, GCP, Azure, Databricks, Snowflake
-
MLOps & Automation: MLflow, Kubeflow, Airflow, GitHub Actions
-
AI & Generative AI: OpenAI API, Hugging Face Transformers
Why is the Data Science Process Important
The data science process provides a structured way to solve problems with data. It helps data scientists avoid errors, stay focused on the right goals, and make sure that their models are delivering valuable insights. By following this process, you can:
- Solve the right problem: Aligning your data analysis with business goals and objectives ensures that you're working on the most important issues.
- Build reliable models: Careful testing and validation of your models ensure they are accurate and perform well on real-world data.
- Make informed decisions: The data science process helps you generate insights that lead to better decisions, whether it's improving business performance or solving complex challenges.
- Avoid common mistakes: By following each step carefully, you can avoid issues like poor data quality, overfitting, or misaligned results.
What is the role of a data scientist?
A data scientist helps businesses make better decisions by turning raw data into useful insights. They gather data from different sources and analyze it using tools like statistics and machine learning to find patterns. These insights can predict future trends and help businesses plan smarter. Data scientists need to know how to use technology and also understand business goals to create solutions that work. After analyzing the data, they present the results in easy-to-understand formats, like charts or reports, so everyone can use the information. A data scientist takes data through a process of gathering, analyzing, modeling, and reporting to help businesses improve and stay competitive. Getting a Data Science Certification can help someone gain the skills needed for this job.
Measuring Business Impact
Beyond model accuracy, modern data science emphasizes ROI and business metrics, such as:
-
Cost savings
-
Revenue growth
-
Customer retention
-
Operational efficiency
Models are only valuable when they improve measurable outcomes, not just produce predictions.
Career Path & Learning Resources
For aspiring data scientists:
-
Build a strong portfolio with end-to-end projects.
-
Learn modern ML frameworks, cloud platforms, and MLOps tools.
-
Practice with Kaggle, GitHub projects, and real datasets.
-
Consider certifications for structured learning, but focus on practical skills.
Future Trends in Data Science
-
Generative AI will assist in data augmentation, reporting, and predictive modeling.
-
Real-time streaming analytics will drive instant decision-making.
-
AI ethics and fairness will become a core part of every project.
-
Automated ML pipelines will accelerate development and reduce human error.
The data science process is all about turning raw data into useful insights. From collecting data to creating and using models, I’ve learned that being good at data science is not just about knowing technical skills. It’s also about being flexible and solving problems along the way. Modern data science adds layers like AI integration, MLOps, and business impact measurement. Each step in the data science process helps transform complex data into practical solutions that can lead to smart decisions and real-world impact.