


Measuring Environmental Impact with Business Analytics
Analytics helps organizations measure, track, and reduce environmental impacts by revealing trends, optimizing resources, and guiding sustainable decisions.
Business Analytics is now a key part of how companies work. It helps teams turn normal business data into clear insights that support better decisions. From understanding customers to improving operations, Business Analytics has become a simple yet powerful way to guide business growth. Today, there is one more area where analytics plays an important role—measuring environmental impact and supporting sustainability efforts. With more people and companies expecting responsible practices, many businesses use data to track energy use, reduce waste, and plan for better resource management.
This blog explains Business Analytics in simple words, how it works, the main types of analytics, and how these methods help companies measure environmental impact. If you are learning through Business Analytics Courses, Business Analytics Certifications, or a Business Analytics Foundation program, this guide will help you understand everything easily.
What Is Business Analytics?
Business Analytics means using data to understand what happened in the past, what is happening now, and what may happen next. Instead of guessing, companies use facts and numbers to make smarter choices.
Data comes from many places—sales, websites, customer feedback, operations, supply chain, and more. Business Analytics organizes this data and turns it into meaningful information.
It usually involves:
-
Collecting data from different systems
-
Cleaning and preparing it
-
Using simple statistical methods
-
Building dashboards
-
Improving decisions based on results
Business Analytics helps teams make decisions using data instead of assumptions.
Why Business Analytics Matters
Companies use analytics for many reasons:
1. Understand What Happened: Helps teams see business performance clearly.
2. Improve Daily Work: Shows areas where time, money, or resources are getting wasted.
3. Find New Opportunities: Highlights new customer needs or market ideas.
4. Solve Problems: Helps identify the cause of performance issues.
5. Make Better Decisions: Data-supported decisions reduce mistakes and improve planning.
6. Support Sustainability: Today, Business Analytics is also used to measure energy use, carbon emissions, and waste to support green goals.
The Four Types of Business Analytics
Business Analytics has four main types, and each one helps answer a different question.
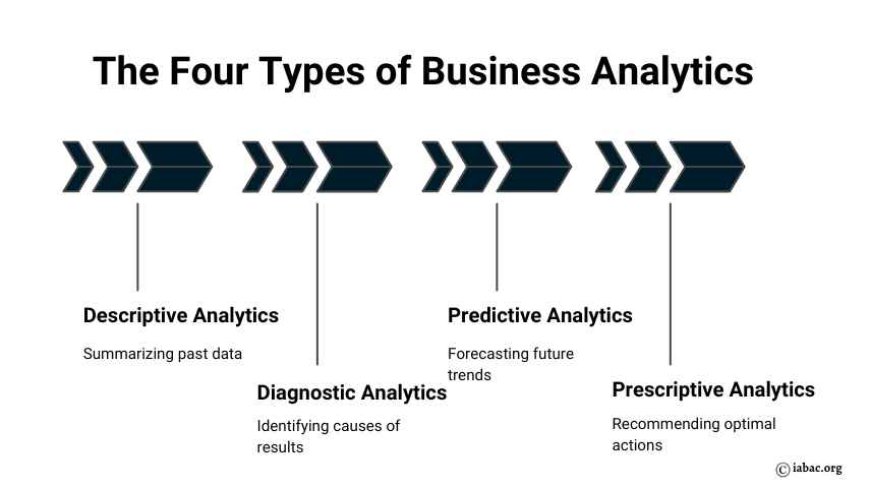
1. Descriptive Analytics – What Happened?
This looks at past data and gives a simple summary.
-
Purpose: Explain past events
-
Example: A dashboard showing last month’s sales
2. Diagnostic Analytics – Why Did It Happen?
This helps find the reason behind the results.
-
Purpose: Identify causes
-
Example: Understanding why website sales dropped
3. Predictive Analytics – What Might Happen?
Predictive models estimate future trends.
-
Purpose: Forecast results
-
Example: Predicting customer cancellations
4. Prescriptive Analytics – What Should We Do?
Suggests the best action for a better outcome.
-
Purpose: Recommend solutions
-
Example: Suggesting the right price for flight tickets
How These Four Types Work Together
Businesses normally follow this order:
-
Descriptive – Understand the past
-
Diagnostic – Find the reasons
-
Predictive – Estimate what may happen
-
Prescriptive – Decide the action
This combined approach supports strong and clear decision-making.
Business Analytics for Environmental Impact Measurement
Many companies now use data to measure their environmental impact. This helps them understand how much energy they use, how much waste they produce, and how they can improve.
Businesses track:
-
Carbon emissions
-
Energy usage
-
Water consumption
-
Waste produced
-
Supply chain emissions (Scope 1, 2, 3)
-
Air quality
-
Progress toward sustainability goals
Examples:
-
Factories checking energy usage to reduce power waste
-
Delivery companies analyzing routes to reduce fuel usage
-
Stores tracking plastic and food waste
-
Hospitals measuring water usage per patient
Business Analytics makes these tasks simple and helps businesses act responsibly.
Environmental Impact Dashboards and Tools
Many tools help companies visualize and understand their environmental data.
Common tools:
-
Power BI sustainability dashboards
-
ESG analytics software
-
IoT sensors for real-time readings
-
Data warehouses like BigQuery
These tools show:
-
Monthly emissions
-
Energy use by branch or store
-
Waste levels
-
Progress toward company goals
Dashboards make it easy for teams to understand performance and take action.
Predictive & Prescriptive Analytics for Sustainability
Analytics not only measures impact but also helps reduce it.
Predictive Use Cases
-
Predicting next month’s energy use
-
Forecasting waste levels
-
Estimating future emissions
Prescriptive Use Cases
-
Planning production schedules to save energy
-
Selecting eco-friendly suppliers
-
Choosing the best delivery routes
-
Finding options to use renewable energy
By combining these ideas, companies can make long-term improvements.
Industry Use Cases of Business Analytics
Retail
-
Forecast demand
-
Improve promotions
-
Manage inventory
Finance
-
Predict risks
-
Improve investment decisions
-
Detect fraud
Healthcare
-
Track patient improvements
-
Predict admissions
-
Manage staff and resources
Supply Chain
-
Improve delivery routes
-
Plan stock levels
-
Reduce delays
Marketing
-
Track campaigns
-
Understand customer behavior
-
Create personalised offers
Sustainability
-
Carbon footprint tracking
-
Energy optimization
-
Waste reduction
-
Climate risk analysis
Challenges in Using Business Analytics
Even with all the benefits, companies face some challenges:
-
Poor or incomplete data
-
Lack of skilled staff
-
Teams not using insights
-
Difficulty scaling dashboards
-
Resistance to new ways of working
Sustainability challenges include:
-
Hard-to-measure supply chain emissions
-
Missing environmental data
-
No common reporting format
How Learners Can Start with Analytics
If you are new to Business Analytics or doing business analyst training, Business Analytics Courses, Business Analytics Certifications, or a Business Analytics Foundation program, here is a simple path:
-
Set clear goals
-
Clean your data
-
Build simple dashboards
-
Find patterns
-
Create basic forecasts
-
Suggest solutions
-
Keep improving
-
Measure results
This approach helps learners understand how analytics works in real life.
Technology Used in Business Analytics
Tools used in this field include:
-
Power BI, Tableau
-
BigQuery, Snowflake
-
Python, R
-
Automated reporting pipelines
-
ESG and sustainability reporting tools
Common Myths About Business Analytics
Myth 1: Only big companies need it.
Small businesses benefit too.
Myth 2: It requires deep technical skills.
Most tools are simple to use.
Myth 3: Predictions are always correct.
Predictions show possibilities, not exact outcomes.
Myth 4: Dashboards stay the same.
They must be updated often.
Myth 5: Environmental impact is too hard to measure.
With the right tools, it becomes easy to track and improve.
Business Analytics helps teams understand the past, find the cause behind results, predict the future, and decide the best action. It also plays a major role in helping businesses measure their environmental impact, reduce waste, and support sustainability. If you are learning through Business Analytics Certifications, Business Analytics Courses, or business analyst training, understanding these ideas will help you make better decisions and support meaningful change in business and environmental areas.