


AI-Powered Data Analytics: Where Machine Learning Meets Big Data
AI-powered data analytics helps businesses make sense of large data, spot trends faster & take smarter actions that improve results & customer experiences.
Data is all around us. Every click, sensor reading, payment, and message creates digital information. Companies and organizations use this information to improve their products, make quicker decisions, build safer systems, and keep customers happy.
This is where AI-powered analytics plays an important role. It brings together smart systems like machine learning with large amounts of information to find useful patterns and insights.
In this blog, you will learn everything in a simple way. We will explain the basics, why it matters in today’s world, the tools people commonly use, and real examples you can understand easily. You will also see how learning through Data Science Certifications can help you build the right skills and start your journey with confidence.
Why AI-Powered Data Analytics Matters
Imagine you own a shop. If you only check sales at the end of the month, you miss chances to reorder fast-moving items, spot a sudden problem, or surprise a repeat customer with an offer. Now imagine a system that watches sales in real time, notices patterns, and suggests what to do next. That’s the core idea: use smart programs to read large piles of data and turn them into clear, useful actions.
Organizations that do this well move faster, save money, and serve customers better. In many cases, AI-driven analytics has moved companies from slow, monthly reporting to near-instant decisions that improve profits and reduce waste. Recent industry pieces also show how AI is changing business analytics workflows and helping teams act faster on data.
What does Big Data mean?
Big data is data that’s large, fast, and varied. People often describe it with three short words: volume, velocity, and variety.
-
Volume: There’s a lot of it: terabytes, petabytes, or more.
-
Velocity: Data arrives fast: streaming events, sensors, or live logs.
-
Variety: Data comes in many forms: text, images, numbers, audio, and more.
Because of these three features, old-school tools and single machines can struggle. That’s why big data often needs distributed systems and new ways of processing.
What is machine learning?
Machine learning is a way to teach a computer to spot patterns and make predictions without writing a long list of rules.
-
If you give it many past examples, it learns what usually happens next.
-
If you give it unlabeled data, it can group things that look similar.
-
If you let it learn by trial and error, it can get better at making a sequence of choices.
Put simply, machine learning helps a system learn from data so the system can predict, classify, or recommend.
Key ideas you’ll hear often:
-
Supervised learning: The computer is shown inputs and the correct answers, and it figures out the link.
-
Unsupervised learning: The computer explores data and finds natural groups or structure.
-
Reinforcement learning: The computer learns by trying things and seeing what works best.
Good features (the parts of the data used for learning) make the difference between a mediocre model and a useful one. Picking and shaping features is called feature engineering, a practical, often creative step in model building.
How machine learning and big data come together
When machine learning meets big data, each side strengthens the other.
-
Big data gives fuel: Many machine learning methods perform better with more varied examples. Large datasets help models learn better patterns and reduce mistakes.
-
Machine learning creates value: It turns raw logs and messy data into predictions, clusters, and alerts that people can act on.
-
Real-time action: Machine learning models can run on streaming data to spot fraud, recommend products, or flag problems as they happen.
As a result, analytics are predictive and prescriptive, instead of just descriptive ("what happened?"). This move helps businesses to act faster and make better decisions.
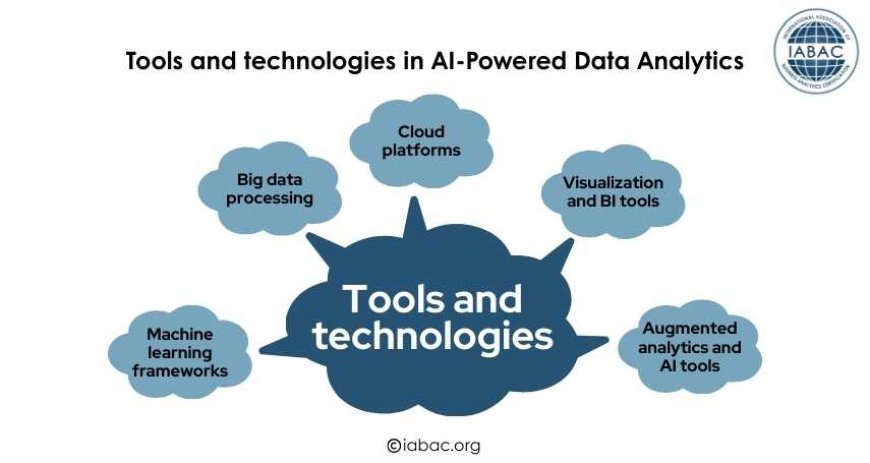
Tools and technologies
You do not have to be an engineer to understand the toolkit. Here's what most teams utilize, and why.
-
Machine learning frameworks: Libraries like TensorFlow and PyTorch help build and train models. They make the math and model management easier.
-
Big data processing: Systems like Apache Spark and Hadoop break large tasks into smaller parts and run them across many machines. These are the workhorses for cleaning, transforming, and aggregating data at scale.
-
Cloud platforms: AWS, Azure, and Google Cloud provide flexible storage, computing power, and many managed services that make it faster to build pipelines and run models. They are popular because you can scale up or down and avoid buying servers. Industry coverage highlights how cloud and AI tools are being used to roll out analytics faster across teams.
-
Visualization and BI tools: Dashboards and reporting tools help people see results. Simple, clear visuals often matter more than model accuracy when communicating with decision-makers.
-
Augmented analytics and AI tools: Newer products layer AI on top of analytics to summarize trends, suggest next steps, or auto-generate charts, making insights available to non-technical staff. Recent industry reporting shows a surge in tools that bring AI directly into analytics workflows.
Real-world examples
Here are some easy examples of how AI-powered analytics is changing outcomes.
1. Fraud detection at a bank
Banks look at thousands of transactions per second. A machine learning model watches transaction patterns and flags strange activity. This lets the bank block fraud faster, often before a customer loses money.
2. Predictive maintenance in factories
Sensors on machines send data constantly. A model learns the signs that a machine will fail soon. Maintenance teams fix the issue before a costly breakdown.
3. Personalized shopping suggestions
E-commerce sites analyze what you browse, what you buy, and when you stop. Models recommend products that are likely to interest you. A better recommendation equals higher sales.
4. Healthcare support
Models analyze patient records and test results to suggest likely diagnoses or treatments. This helps doctors by highlighting risks or options they might otherwise miss.
These are not futuristic; they are happening now across industries, and they work best when humans and machines collaborate.
How to structure an AI-powered analytics project
If you want to make one, take a clear path:
-
Define the question. Be specific. "Increase sales" is broader. "Reduce price markdowns by 10%" is accurate.
-
Collect data: Determine what data you require and where it lives.
-
Clean and Prepare: Remove duplicates, correct errors, and format the data. This is usually the most time-consuming process.
-
Analyze the data: Look for patterns, missing values, and evident problems.
-
Choose a model and tools: Start simple. Baseline models often beat over-complex solutions early on.
-
Train and validate: Test on data the model hasn’t seen. This reduces surprises in real use.
-
Deploy and monitor: Put the model into production and watch how it performs. Data changes over time, so models need upkeep.
-
Measure impact: Track real business outcomes, not just model accuracy. Ask: Did it improve the metric we cared about?
Who should be on the team?
Successful projects combine skills:
-
Domain expert: Understands the business question and what good looks like.
-
Data engineer: Builds pipelines to move and store data reliably.
-
Data scientist / ML engineer: Builds models and selects algorithms.
-
Product or project manager: Keeps the work aligned with business goals.
-
Designer/analyst: Translates output to reports and dashboards for users.
The best teams work iteratively and keep communication open.
Ethical concerns and how to handle them
AI systems can be extremely useful, yet they can also make mistakes that are damaging to humans. Here are some basic ways to reduce risk:
-
Protect your privacy: Do not collect unnecessary data. Personal information should be masked or anonymized whenever possible.
-
Keep an eye out for bias: Run models to see whether they produce unfair results for different groups.
-
Be transparent: Explain in human-readable language what decisions the model makes and why.
-
Assign responsibility: Choose someone to be accountable for modeling conduct and responding to difficulties.
-
Log and monitor: Keep track of model outputs and inputs so you can study them later.
Responsible design is an essential part of engineering, not an option.
Common mistakes and how to avoid them
-
Skipping the problem definition: Build the wrong solution if you don’t start with a clear goal.
-
Overfitting: A model that only “remembers” the training data won’t help in the real world.
-
Ignoring data quality: Garbage in, garbage out.
-
Neglecting monitoring: Models degrade; you must watch and update them.
-
Making systems opaque: If users don’t understand or trust the model, adoption suffers.
Avoid these by staying practical, starting small, and measuring impact.
Future trends to watch
The field moves fast. Here are trends you should know about in plain words:
-
AI at the edge: Using models on devices (such as phones or sensors) to make quick choices and reduce the need to transfer all data to the cloud.
-
Explainable AI: A simpler way to explain why a model made a specific conclusion.
-
Federated learning: Models learn from data stored on multiple devices without transferring the data to a central location, which improves privacy.
-
Quantum possibilities: In the long run, quantum computing may tackle issues that are too difficult for today's computers; this is yet an exploring field.
-
Responsible AI and rules: Organizations and governments are developing guidelines and standards to ensure that AI is fair and safe.
These trends shape how analytics tools will be built and used in the next few years. Industry writers and analysts are noting how AI is reshaping analytics work and organizational roles, highlighting the move from data hygiene to strategic AI adoption.
Practical starting points
If you're looking to get hands-on quickly, follow these simple steps:
-
Select one clear problem: Such as decreasing returns or increasing email open rates.
-
Collect a little dataset: Export a month or two of pertinent data into a spreadsheet.
-
Visualize the data: Plot counts, trends, and missing values. Even basic charts can show a lot.
-
Try a basic model: Use a built-in tool (many cloud providers and BI products offer basic predictive capabilities).
-
Share the results: Stakeholders will be presented with the findings and proposed future steps. Receive feedback and iterate.
The idea is to learn through experience; small experiments develop both understanding and trust.
AI-powered data analytics isn't a magic box. It is a set of practical approaches that enable teams to make fast judgments from huge quantities of complex data. The tools and math are great, but what truly matters are clear objectives, clean data, the correct team, and responsible practice.
Begin with a simple, measurable problem. Create a small pilot, measure the important outcomes, then scale what works. Keep ethics and monitoring in mind from the start; they are not add-ons, but essential components of any successful implementation.
If you're sharing this on your website, help visitors by providing a checklist or a one-page starter guide to download: this type of practical takeaway encourages people to act on what they read and increases engagement.
Consider the data analytics certification if you need targeted, industry-specific expertise in data analytics and business applications.