


Data Analytics Tools and Techniques for Beginners
Data analytics is the #1 skill of 2026. Learn the top tools, techniques & tips every beginner needs to get started fast, no coding background required.
Every day, companies are sitting on goldmines, and most of them don't even know it.
That goldmine is data. And the people who know how to read it? They're among the most wanted professionals in the world right now.
You don't need a math degree. You don't need to be a coding genius. You just need to know where to start, and that's exactly what this guide is for.
Whether you're a fresh graduate, a career switcher, or just someone curious about where the jobs are heading, data analytics might be the most practical skill you can pick up in 2026.
What Exactly Is Data Analytics?
At its core, data analytics is the process of looking at raw information and finding something useful in it. Think of it like this — imagine you run a small bakery and you've been jotting down daily sales for six months. Data analytics is what helps you figure out that chocolate muffins sell twice as fast on weekends, or that Monday mornings are your slowest period. That information can then shape real decisions: what to bake more of, when to offer discounts, and when to hire extra help.
That same logic applies to companies of all sizes — from startups to hospitals to sports franchises. They all have data. The ones who know how to read it make better decisions than the ones who don't.
Why Learning This Skill Makes Sense Right Now
Data is being generated faster than ever. Every app you use, every purchase you make, every search you type — it all becomes data somewhere. Businesses are drowning in it, and they need people who can make sense of it. The global data analytics market is projected to grow from $104.39 billion in 2026 to $495.87 billion by 2034, that's nearly a 5x jump in under a decade.
The demand for people who can work with data has grown steadily, and that trend isn't slowing down. What's changed in 2026 is that you don't need to be a data scientist with a PhD to get your foot in the door. Many roles are open to people who know the right tools and can think clearly about numbers. That's it.
4 Types of Data Analytics
Before diving into tools, you need to understand the different things you can actually do with data. There are four main types:
1. Descriptive Analytics: This is the starting point. It answers the question: "What happened?" You're looking at past data and summarizing it. Example: your website got 10,000 visitors last month, and 60% came from mobile devices.
2. Diagnostic Analytics: One step deeper — this answers "Why did it happen?" You're investigating patterns to find reasons. Example: website traffic dropped in July because a key page was broken.
3. Predictive Analytics: Now you're looking forward. This answers "What's likely to happen next?" It uses past patterns to make forecasts. Example: Based on last year's data, sales will likely spike in December.
4. Prescriptive Analytics: The most advanced type. It answers "What should we actually do?" It doesn't just predict — it recommends. Example: if you increase your ad budget by 20% in November, you'll likely see a 35% revenue bump in December.
Most beginners spend their early days in descriptive and diagnostic analytics. That's perfectly fine. The goal is to understand your data before you try to predict anything.
Essential Tools Every Beginner Should Know
Here's where most beginner guides get it wrong — they list 15 tools and leave you feeling overwhelmed. So let's be practical. These are the tools that actually matter when you're starting, in the order you should learn them.
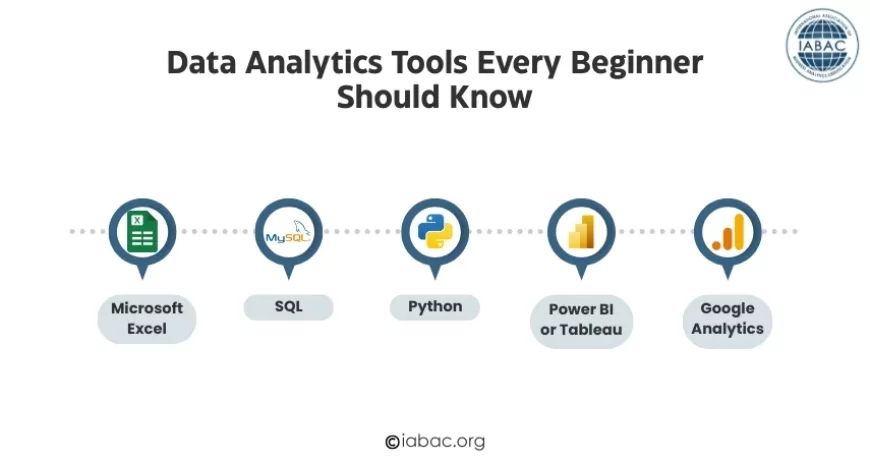
Microsoft Excel: Start Here, No Exceptions
Excel is not glamorous. But it's everywhere, and for good reason. It lets you organize data, run basic calculations, build pivot tables, and create simple charts — all without writing a single line of code.
Here's why it matters: almost every dataset you work with as a beginner will pass through Excel at some point. Learning it well gives you a massive head start. Spend real time with features like:
-
Pivot tables (for summarizing large datasets quickly)
-
VLOOKUP / XLOOKUP (for connecting data across sheets)
-
Conditional formatting (for spotting patterns visually)
-
Basic formulas like SUM, AVERAGE, COUNT, IF
Don't rush past Excel to get to flashier tools. The discipline you build here carries over to everything else.
SQL: The Skill Everyone Wishes They'd Learned Sooner
If there's one thing missing from most beginner guides — and the one that hiring managers consistently ask for — it's SQL. Structured Query Language is how you talk to databases. And since pretty much all business data lives in databases, this becomes essential fast.
SQL reads almost like plain English. A basic query looks like this:
"Select all customers who made a purchase in the last 30 days and live in California."
That's essentially what you write, just in SQL syntax. The logic is intuitive once you get past the initial learning curve.
Key things to learn in SQL:
-
SELECT, WHERE, and FROM (the basics of pulling data)
-
GROUP BY and ORDER BY (for sorting and summarizing)
-
JOINs (for combining data from multiple tables)
-
Aggregate functions like COUNT, SUM, AVG
Free platforms like SQLZoo, Mode Analytics, and Kaggle let you practice on real datasets without spending a rupee. Give SQL a solid 3–4 weeks of daily practice before moving on.
Python: When You're Ready to Go Deeper
Python is where things get more powerful. It's a programming language, yes, but it's one of the friendliest ones for beginners. You use it to clean messy data, run more complex analysis, automate repetitive tasks, and eventually build predictive models.
The two libraries you'll use most as a beginner analyst:
-
Pandas: For loading, cleaning, and transforming data.
-
Matplotlib / Seaborn: For creating charts and visual summaries.
You don't need to become a Python developer. You just need to be comfortable enough to write scripts that handle data efficiently. Once you hit that level, your speed and range as an analyst increase dramatically.
Power BI or Tableau: Making Data Visual and Shareable
Analysis that lives in a spreadsheet only helps you. Analysis that's turned into a clear, interactive dashboard helps your whole team, including people who've never touched a dataset.
That's what Power BI and Tableau do. They take your clean, analyzed data and turn it into something anyone can understand at a glance.
Power BI is great if you work in a Microsoft-heavy environment (which most Indian companies do). It integrates easily with Excel, Teams, and SharePoint.
Tableau is slightly more flexible visually and is widely used in global companies. Both are worth knowing, but pick one to start.
Things to practice:
-
Building bar charts, line graphs, and pie charts
-
Creating dashboards that update automatically
-
Designing reports that tell a clear story
Google Analytics: For Anyone Working with Websites
If digital marketing, e-commerce, or content is part of your world, Google Analytics is non-negotiable. It shows you exactly what's happening on a website, where visitors come from, what they click, how long they stay, and where they leave.
It's free, it's beginner-friendly, and it's used by nearly every business with a website. Even understanding the basics makes you more valuable in almost any marketing or product role.
The Technique Nobody Talks About Enough: Data Cleaning
Here's a reality check that most beginner content skips over entirely, data cleaning is not a minor step. It is the bulk of the work. In real-world projects, cleaning your data can take up 70–80% of your total time.
Real data is messy. It has:
-
Missing values (blank cells where information should be)
-
Duplicates (the same record entered twice)
-
Formatting inconsistencies (dates written as "01/04/2025" in one column and "April 1st" in another)
-
Outliers (a customer listed as 200 years old)
Learning to identify and fix these issues — in Excel, SQL, or Python — is what separates beginners who build reliable analyses from those who draw wrong conclusions from bad data.
A Simple Learning Path to Follow
Forget trying to do everything at once. Here's a realistic order that works:
-
Week 1–3: Master Excel basics — pivot tables, key formulas, simple charts.
-
Week 4–7: Learn SQL — focus on SELECT queries, JOINs, and GROUP BY.
-
Week 8–12: Introduction to Python — Pandas and basic data visualization.
-
Week 13–16: Pick Power BI or Tableau — build your first dashboard.
-
Ongoing: Work on real projects using public datasets from Kaggle or data.gov.in
The single biggest mistake beginners make is completing courses without building anything. No employer cares how many courses you've finished. They want to see what you've actually done with that knowledge. Build 3–5 small projects, put them on GitHub, and you'll stand out immediately.
Common Beginner Mistakes (and How to Avoid Them)
-
Skipping SQL: It's not optional. Learn it before Python.
-
Ignoring data cleaning: Clean data is the foundation of accurate analysis.
-
Collecting certificates instead of building projects: Certificates support your resume. Projects prove your skills.
-
Jumping to machine learning too early: Walk before you run. Nail the basics first.
-
Trying to learn everything at once: Pick one tool, go deep, then expand.
Data analytics is one of those skills where the entry barrier feels high but actually isn't — once you know where to start. You don't need to be a math genius. You don't need a computer science background. You need curiosity, patience, and a willingness to practice on real data.
Start with Excel. Add SQL. Build something. Then keep going.
The numbers will start telling you stories you never expected — and that's when this work gets genuinely exciting. And when you're ready to validate everything you've learned, the Data Analytics Certification gives your skills the professional recognition that employers actually trust.