


Exploring Types of Business Analytics
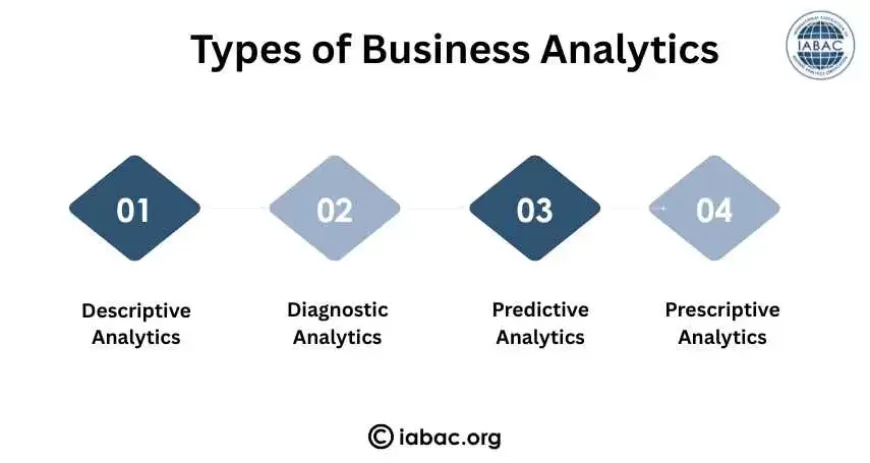
Business analytics has four core types: descriptive, diagnostic, predictive and prescriptive. Learn what each does and how it drives smarter business decisions.
Most businesses collect data. Far fewer know which type of analytics to apply, and that gap is exactly where decisions go wrong. Business analytics is not a single method. It is a structured framework of four distinct types, each designed to answer a different business question. Knowing the difference between them is what separates organizations that react to problems from those that prevent them.
This blog breaks down each type of business analytics: what it does, how it works, where it applies, and what tools and techniques power it so practitioners and decision-makers can apply the right approach at the right time.
1. Descriptive Analytics: Understanding What Happened
Descriptive analytics is the foundation of all business intelligence. It processes historical data to identify patterns, summarize performance, and answer one core question: what happened? It does not predict or prescribe it; it documents. That documentation is what gives leadership a shared view of reality before any decision is made.
Without descriptive analytics, organizations lack a reliable baseline. Every strategic discussion becomes an argument about facts rather than a conversation about direction.
How it works in practice:
Sales reports track revenue trends across months, quarters, or product lines, revealing which offerings drive volume and which consistently underperform. A regional sales breakdown, for example, can show whether a decline is company-wide or isolated to a specific market.
Financial summaries: profit/loss statements, balance sheets, and cash flow reports give stakeholders a quantified view of company health across a defined period, enabling accurate performance reviews and investor reporting.
Customer behavior reports surface purchase frequency, churn rates, average order values, and segment-level performance over time, giving marketing and product teams a factual picture of how customers engage.
Operational dashboards consolidate key performance indicators across departments, allowing managers to monitor output, utilization, and efficiency in near real time.
Common tools:
- Excel remains the baseline for data organization, formula-based calculations, and chart generation. Its accessibility makes it the starting point for most analysts regardless of industry.
- Tableau builds interactive dashboards that make pattern recognition visual and accessible to non-technical stakeholders, reducing the gap between data teams and business leadership.
- SQL retrieves and aggregates large datasets from relational databases, enabling precise, repeatable queries that form the backbone of most enterprise reporting systems.
- Power BI integrates with Microsoft's data ecosystem to deliver real-time reporting across business units, with strong governance and role-based access controls.
Descriptive analytics is not sophisticated by design; it is reliable. Organizations that skip this foundational layer before jumping to predictive models often find their advanced outputs lack credibility because the underlying data was never properly understood or validated.
2. Diagnostic Analytics: Understanding Why It Happened
Descriptive analytics tells you sales dropped 18% in Q3. Diagnostic analytics tells you why they dropped. This is the investigative layer of the analytics framework; it moves from observation to causation, giving analysts and business leaders the tools to trace outcomes back to their origins rather than responding to surface-level symptoms.
Diagnostic analytics is particularly valuable when performance deviates significantly from expectations. It prevents organizations from acting on assumptions when data-backed explanations are available.
Core techniques:
Data mining systematically scans large datasets to surface non-obvious patterns, correlations, and anomalies. It can identify that a drop in customer retention began among a specific demographic segment before it became visible in aggregate numbers.
Correlation analysis measures the statistical relationship between variables. It can quantify whether an increase in customer support tickets correlates with a drop in repeat purchase rates or whether regional weather patterns affect product demand cycles.
Root Cause Analysis (RCA) uses structured frameworks like the "5 Whys," fishbone diagrams, and fault tree analysis to systematically trace a specific problem to its origin. The goal is not just to fix the current issue but to prevent recurrence by addressing the actual cause rather than its effects.
Drill-down analysis allows analysts to move from high-level summaries into granular subsets of data, isolating exactly where performance broke down by region, product line, time period, or customer segment.
Diagnostic analytics is frequently underused in organizations that move too quickly from data collection to prediction. Skipping this step means building predictive models on top of patterns that are not yet understood, a structural error that surfaces when models produce outputs that contradict business reality.
3. Predictive Analytics: Understanding What Will Happen
Predictive analytics applies statistical models and machine learning algorithms to historical data to generate probability-based forecasts. It answers the question: What is likely to happen next, and with what confidence? This is where analytics transitions from retrospective analysis to forward-looking strategy.
Predictive analytics does not eliminate uncertainty; it quantifies it. Organizations that treat predictions as certainties rather than probabilities consistently misapply this tool and make overconfident decisions.
Methods used:
Statistical models: regression-based approaches estimate the probability of specific outcomes. Logistic regression, for instance, can calculate the likelihood of customer churn based on login frequency, support interactions, and contract renewal proximity.
Machine learning algorithms: models such as decision trees, random forests, gradient boosting, and neural networks improve their predictive accuracy iteratively as they process more labeled historical data. They are particularly effective in high-dimensional datasets where human analysts cannot identify the relevant variables manually.
Time series analysis examines data points sequenced over time to project future values. It is commonly applied to demand forecasting, revenue projection, and inventory planning, particularly in industries with strong seasonal or cyclical patterns.
Propensity modeling scores individual customers or accounts based on their likelihood to take a specific action (purchasing, churning, or upgrading), enabling sales and marketing teams to prioritize outreach based on conversion probability.
Industry applications:
Finance: Credit risk scoring models evaluate borrower profiles to predict default probability. Fraud detection systems flag transaction anomalies in real time. Investment algorithms assess asset volatility and portfolio risk under various market scenarios.
Retail: demand forecasting models reduce overstock and stockouts by predicting category-level and SKU-level sales volumes. Recommendation engines increase basket size by surfacing products aligned with individual purchase histories.
Healthcare: Patient admission forecasting helps hospitals allocate staffing and resources ahead of demand surges. Predictive models also identify high-risk patients for early intervention, reducing avoidable readmissions and complications.
Manufacturing: predictive maintenance models monitor equipment sensor data to flag degradation patterns before failure occurs, reducing unplanned downtime and extending asset life.
Human Resources: Attrition prediction models identify employees at risk of resignation based on engagement scores, tenure, compensation benchmarks, and performance trends, allowing HR teams to intervene proactively.
4. Prescriptive Analytics: Understanding What to Do
Prescriptive analytics is the most advanced layer of the framework. It does not just forecast outcomes; it evaluates a range of possible actions and recommends the one most likely to produce the desired result. The question it answers is not what will happen but what should we do about it and why.
This type of analytics is increasingly applied in high-stakes, high-volume decision environments where the cost of suboptimal choices is significant and the decision space is too complex for human judgment alone.
Technologies that power it:
Optimization algorithms
Optimization algorithms are mathematical models that evaluate constraints and objectives simultaneously to identify the most efficient solution.
- Logistics companies use them to calculate delivery routes that minimize fuel consumption against time windows and vehicle capacity.
- Retailers use them to allocate marketing budgets across channels based on expected return per rupee spent.
Simulation modeling
Simulation modeling produces computer representations of real systems, allowing organizations to experiment with the downstream effects of decisions before they make them.
A supply chain simulation, for example, can model the impact of a supplier disruption on delivery timelines and inventory levels across multiple distribution centers.
Decision trees and rule-based systems
Decision trees and rule-based systems encode business logic and predictive outputs into automated decision frameworks, enabling organizations to operationalize recommendations at scale without requiring analyst intervention at every step.
Reinforcement learning
Reinforcement learning trains models to optimize decisions over time by rewarding outcomes that align with business objectives, particularly useful in dynamic pricing, ad bidding, and real-time resource allocation.
Prescriptive analytics requires clean historical data, validated predictive models, and well-defined objective functions.
Organizations that attempt this layer before establishing reliable descriptive and diagnostic foundations typically see poor adoption and inconsistent outputs that undermine trust in the analytics function.
5. Emerging Trends Reshaping Business Analytics
New developments in business analytics are being driven by advances in artificial intelligence and big data infrastructure. These are not incremental improvements; they represent structural shifts in how analytics is practiced, who can access it, and what decisions it can inform.
Key directions shaping the field:
AI-augmented analytics
AI-augmented analytics is enabling non-technical users to query data in natural language, reducing dependency on SQL expertise and widening analytics access across organizations. Business leaders can now ask questions directly of their data without routing every request through an analyst.
Real-time analytics pipelines
Real-time analytics pipelines powered by streaming platforms like Apache Kafka and Apache Flink allow organizations to run descriptive and predictive analytics on live data rather than batch-processed historical sets. This is critical in industries like financial services and e-commerce, where decisions have sub-second windows.
Automated machine learning (AutoML)
Automated machine learning (AutoML) reduces time-to-deployment for predictive models by automating feature selection, model training, and hyperparameter tuning. It lowers the technical barrier for organizations that lack large data science teams.
Hyper-personalization
Hyper-personalization at scale applies predictive and prescriptive models at the individual customer level, enabling marketing, product, and service experiences tailored to specific behavioral profiles rather than broad demographic segments.
Embedded analytics
Embedded analytics integrates analytical outputs directly into operational software, CRMs, ERPs, and supply chain platforms, so frontline teams receive data-driven recommendations within the tools they already use, without switching contexts.
Explainable AI (XAI)
Explainable AI (XAI) addresses the growing demand for transparency in model outputs. As predictive and prescriptive models influence high-stakes decisions like credit approvals, medical diagnoses, and hiring, regulatory and ethical pressure is pushing organizations toward models that can articulate why a recommendation was made.
These shifts are increasing demand for professionals who can operate across all four analytics types, not just build dashboards or run queries, but also connect analytical outputs to business strategy and translate model recommendations into actionable plans.
The four types of business analytics, descriptive, diagnostic, predictive, and prescriptive, form a progression from understanding the past to shaping the future. Each layer builds on the one before it, moving from baseline reporting to optimal decision-making. The competitive advantage does not come from having the most data; it comes from knowing which analytical lens to apply to a given business problem.
For professionals looking to build credible expertise across this full spectrum, business analytics certification provides structured training in analytics tools, data interpretation, reporting methods, and strategic thinking required to connect data to real business decisions.