Data Analytics Interview Questions with Examples
Prepare for data analytics interviews with common questions and clear examples covering SQL, Python, statistics, visualization, and real-world scenarios.

Companies no longer make decisions based on assumptions. They rely on accurate analysis of customer behavior, operational efficiency, financial trends, and marketing performance. This growing demand for professionals who can interpret data has made the role of a Data Analytics Consultant or analyst highly competitive.
If you are preparing for a data analytics role, understanding the most common Data Analytics Interview Questions and their practical applications is essential. This guide provides a complete overview of frequently asked questions, detailed answers, examples, metrics, and formulas to help you succeed in interviews.
Whether you are pursuing Data Analytics Certifications, aiming to understand Data Analytics for Managers, or preparing for hands-on projects, this blog will give you a complete roadmap to excel in data analytics interviews.
What is Data Analytics and Why Is It Important?
Answer:
Data analytics is the process of inspecting, cleaning, transforming, and modeling data to discover useful insights that inform business decisions. It is used to identify patterns, correlations, and trends in business operations and customer behavior.
Example:
A retail company uses sales and customer data to identify which products are most profitable during a festival season.
Metric/Formula:
- Revenue Contribution:
- Example: If a product generates $20,000 and total sales are $100,000:
This shows the product contributes 20% to total sales, helping the company decide marketing spend.
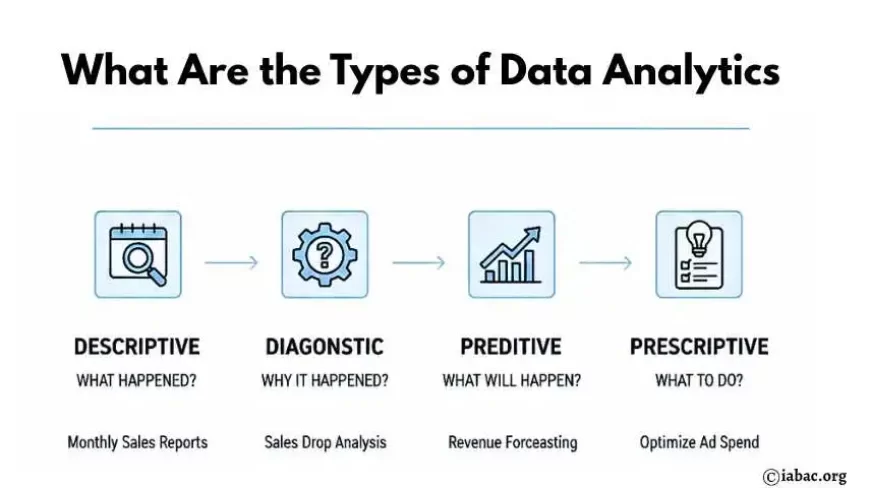
What Are the Types of Data Analytics?
1. Descriptive Analytics — What happened?
This type looks at past data to understand what has already occurred.
- Summarizes historical data
- Uses reports, dashboards, and charts
- Gives a clear picture of performance
Example:
Monthly sales report showing total revenue for the last 12 months.
2. Diagnostic Analytics — Why did it happen?
This type tries to find the reason behind what happened.
- Compares data
- Finds patterns and relationships
- Identifies root causes
Example:
Analyzing why sales dropped in one region by checking pricing, marketing spend, and customer feedback.
3. Predictive Analytics — What is likely to happen?
This type uses past data to predict future outcomes.
- Uses statistical models and machine learning
- Forecasts trends and behavior
Example:
Predicting next month’s sales based on previous sales trends.
4. Prescriptive Analytics — What should we do?
This type suggests actions based on predictions.
- Recommends decisions
- Helps choose the best strategy
Example:
Suggesting increasing marketing budget for products expected to perform well next month.
5. Inferential Statistics — What can we conclude from a sample?
This type uses a small sample of data to make conclusions about a larger population.
- Uses hypothesis testing, p-value, confidence intervals
- Helps in decision-making with limited data
Example:
Surveying 500 customers to understand the preference of 50,000 customers.
| Type | Question Answered | Example |
|---|---|---|
| Descriptive | What happened? | Sales report |
| Diagnostic | Why did it happen? | Reason for the sales drop |
| Predictive | What will happen? | Sales forecast |
| Prescriptive | What should we do? | Increase ad budget |
| Inferential | What can we conclude? | Customer survey analysis |
Example:
- Descriptive: Monthly sales reports
- Diagnostic: Analyzing why sales dropped in a region
- Predictive: Forecasting next month’s revenue using regression models
- Prescriptive: Suggesting increasing ad spend for high-performing products
Metric/Formula:
Linear Regression (Predictive Analytics):
Where = dependent variable, = independent variable, = intercept, = slope, = error term
What Are KPIs, and Can You Give Examples?
Answer: KPIs (Key Performance Indicators) are measurable values that indicate how effectively a company achieves its business objectives.
Example:
-
Conversion Rate =
-
Customer Retention Rate =
Practical Example:
If a website had 1,000 visitors and 50 made purchases:
Importance:
KPIs help managers, including those using Data Analytics for Managers concepts, make informed decisions and track performance effectively.
What Is Data Cleaning, and Why Is It Important?
Answer:
Data cleaning is the process of removing or correcting errors, inconsistencies, and missing values from datasets.
Example:
- Duplicate rows in a sales report
- Missing customer email addresses
- Incorrect date formats
Metric/Formula:
-
Percentage of Missing Values:
Practical Insight:
If a dataset has 1,000 rows and 50 missing values:
missing data
Cleaning ensures analysis is accurate, which is critical for managers making data-backed decisions.
Explain the Difference Between Supervised and Unsupervised Learning
Answer:
- Supervised Learning: Predicts an outcome using labeled data.
- Unsupervised Learning: Identifies patterns in data without labeled outcomes.
Example:
- Supervised: Predicting if a customer will churn (Yes/No)
- Unsupervised: Clustering customers based on purchase behavior
Metric/Formula:
-
Accuracy (Supervised Model):
What Is A/B Testing in Data Analytics?
Answer:
A/B testing is an experiment comparing two versions of a variable to determine which performs better.
Example:
- Testing two email campaigns: Version A vs Version B
- Measure: Open rate or click-through rate
Metric/Formula:
-
Conversion Rate:
Practical Insight:
If email A gets 200 clicks from 2,000 recipients:
conversion
How Do You Handle Outliers in Data?
Answer:
Outliers are values significantly different from the rest of the data. Handling outliers depends on context:
- Remove them if they are errors
- Transform them using log or z-score normalization
- Keep them if they are valid observations
Metric/Formula:
-
Z-Score Method:
Where = data point, = mean, = standard deviation
Example:
If a sales dataset has a value 3 standard deviations away from the mean, it may be an outlier.
Explain Correlation and Causation with Example
Answer:
- Correlation: Two variables move together but one does not cause the other.
- Causation: One variable directly affects the other.
Example:
- Correlation: Ice cream sales and swimming pool visits increase together in summer
- Causation: Temperature increases directly cause higher ice cream sales
Metric/Formula:
-
Correlation Coefficient (r):
What Are the Common Data Analytics Tools?
Answer:
- Excel: Data cleaning, pivot tables, charts
- SQL: Querying relational databases
- Python: Advanced analytics, data manipulation
- R: Statistical analysis
- Power BI / Tableau: Visualization and dashboards
Example:
A consultant might use SQL to extract data, Python to clean it, and Tableau to create a visual dashboard for managers.
Explain the Concept of Regression Analysis with Example
Answer:
Regression analysis predicts a dependent variable based on one or more independent variables.
Example:
Predicting sales () based on advertising spend ():
Where = intercept, = slope, = error term
Practical Insight:
If increasing ad spend by $1,000 increases sales by $5,000, this relationship can guide future budgeting decisions.
What Are the Most Common Data Cleaning Techniques?
Answer:
- Handling missing values (mean/median imputation)
- Removing duplicates
- Standardizing data formats
- Outlier detection using Z-score or IQR
- Data transformation (log, normalization, scaling)
Example:
If a dataset has missing age values, fill using the average age of all records.
What Is the Difference Between Structured and Unstructured Data?
Answer:
- Structured Data: Organized in rows and columns (e.g., Excel, SQL databases)
- Unstructured Data: Not organized, e.g., text, images, videos
Example:
- Structured: Sales numbers
- Unstructured: Customer reviews
Practical Insight:
Data analytics consultants use different tools to process structured (SQL) and unstructured data (Python, NLP tools).
Why Are Data Analytics Certifications Important?
Answer:
Data Analytics Certifications validate your skills in tools, concepts, and real-world applications. Employers often look for certifications to ensure candidates have industry-standard knowledge.
Example:
- Certified courses via the IABAC domain provide practical case studies and dashboard-building experience.
Behavioral Questions Often Asked
Examples:
- Describe a situation where data analysis influenced a business decision.
- Explain a time when you identified an error in a dataset and corrected it.
- How do you prioritize tasks when working on multiple analytics projects?
Tip: Use the STAR method (Situation, Task, Action, Result) to answer these effectively.
What is the difference between WHERE and HAVING?
Answer:
WHEREfilters rows before aggregationHAVINGfilters results after aggregation
Example Query:
SELECT department, COUNT(*) AS employee_count
FROM employees
GROUP BY department
HAVING COUNT(*) > 10;
Business Use Case:
This query helps managers identify departments with more than 10 employees for workforce planning.
What is a JOIN and its types?
Answer:
A JOIN combines data from two or more tables based on a related column.
Types:
- INNER JOIN
- LEFT JOIN
- RIGHT JOIN
- FULL JOIN
Example:
SELECT o.order_id, c.customer_name
FROM orders o
INNER JOIN customers c
ON o.customer_id = c.customer_id;
This helps link customer information with order data.
What is the difference between mean and median?
Answer:
- Mean: Average of values
- Median: Middle value when data is sorted
Formula:
Example:
Dataset: 10, 20, 30, 100
- Mean = 40
- Median = 25
Why it matters:
Median is preferred when data has outliers.
What is Standard Deviation?
Answer:
Standard deviation measures how spread out data points are from the mean.
Formula:
Business Example:
Used to measure variability in sales or customer spending behavior.
How do you choose the right chart?
Interviewers ask this to check whether you can communicate insights clearly, not just perform calculations.
Choosing the right chart depends on what you want the audience to understand from the data.
Answer
- Bar Chart → Comparison
Use when comparing values across categories.
Example: Sales across different products or regions. - Line Chart → Trends Over Time
Best for showing growth, decline, or patterns across time periods.
Example: Monthly or yearly revenue growth. - Pie Chart → Proportions
Use to show parts of a whole when categories are few.
Example: Market share of different brands. - Histogram → Distribution
Shows how data is distributed across ranges or intervals.
Example: Distribution of customer ages or salary ranges.
Example
If you want to show monthly revenue growth, a line chart is the correct choice because it clearly shows the trend over time. Using a pie chart here would not make sense, as pie charts do not represent time-based trends effectively.
What makes a good dashboard?
Answer:
A good dashboard is:
- Simple
- Focused on KPIs
- Easy for non-technical users
This is critical for Data Analytics for Managers, where decisions must be made quickly.
What is ETL?
Answer:
ETL stands for:
- Extract data from sources
- Transform it into usable format
- Load it into a data warehouse
Example:
Extract sales data → clean currency values → load into Power BI.
What is a Data Warehouse?
Answer:
A data warehouse is a centralized repository for structured data used for reporting and analytics.
Examples:
- Snowflake
- Amazon Redshift
- Google BigQuery
Case studies test real decision-making ability.
Sales are dropping. How would you analyze the problem?
Answer:
Steps:
- Check historical sales trend
- Segment by region, product, channel
- Compare marketing spend vs revenue
- Identify anomalies
- Recommend action
Metrics Used:
How do you explain analytics to a non-technical manager?
These questions test how well you communicate with leadership.
Answer:
- Avoid technical jargon
- Use visuals and comparisons
- Focus on business impact
- Explain “what to do next”
This skill is essential for consultants working with executives.
How do you ensure data privacy?
This topic is increasingly important.
Answer:
- Mask sensitive data
- Follow access control
- Use anonymization
- Comply with regulations
Example:
Customer names and emails should never appear in shared dashboards.
Why did you choose Data Analytics Certifications?
Interviewers often ask about certifications.
Answer:
Data Analytics Certifications show:
- Structured learning
- Practical exposure
- Industry alignment
What Is Hypothesis Testing?
Interview Question: What is hypothesis testing in data analytics?
Answer:
Hypothesis testing is a statistical method used to make decisions or inferences about a population based on sample data.
It starts with two statements:
-
Null Hypothesis (H₀): Assumes no effect or no difference
-
Alternative Hypothesis (H₁): Assumes there is an effect or a difference
The goal is to test whether there is enough evidence to reject the null hypothesis.
Example:
A company believes a new marketing campaign increases sales.
-
H₀: The campaign does not increase sales
-
H₁: The campaign increases sales
We test this using sample sales data before and after the campaign.
What Is a P-Value?
Interview Question: What is a p-value?
Answer:
The p-value is the probability of obtaining results at least as extreme as the observed results, assuming the null hypothesis is true.
It helps determine whether to reject the null hypothesis.
Decision Rule:
- If p-value ≤ 0.05 → Reject H₀ (statistically significant)
- If p-value > 0.05 → Fail to reject H₀ (not significant)
Example:
After testing a marketing campaign, the p-value is 0.03.
Since 0.03 < 0.05, we reject the null hypothesis and conclude the campaign had a significant effect on sales.
What Tests Are Used to Get the P-Value?
Interview Question: Which statistical tests are used to calculate the p-value?
Answer:
The test depends on the type of data and problem.
| Test | When to Use | Example |
|---|---|---|
| T-Test | Compare means of two groups | Sales before vs after campaign |
| Z-Test | Large sample size, known variance | Website conversion rates |
| Chi-Square Test | Categorical data | Gender vs product preference |
| ANOVA | Compare means of 3+ groups | Sales across 3 regions |
| Correlation Test | Relationship between variables | Ad spend vs revenue |
Example: T-Test Formula
Where:
-
= sample means
-
= variances
-
= sample sizes
This test produces a p-value to decide if the difference between two means is significant.
Where Do We Use Mean, Median, and Mode?
Interview Question: When should you use mean, median, and mode?
These are measures of central tendency used based on the type of data.
Mean (Average)
Formula:
Use When:
- Data has no extreme outliers
- Numerical data is evenly distributed
Example:
Average monthly sales of a store.
Median (Middle Value)
Use When:
- Data has outliers
- Skewed distribution
Example:
Salary data in a company where a few people earn very high salaries. Median gives a better central value than mean.
Dataset: 20k, 25k, 30k, 35k, 5,00,000
- Mean = very high and misleading
- Median = 30k (more realistic)
Mode (Most Frequent Value)
Use When:
- Categorical data
- Finding most common occurrence
Example:
Most purchased product category in a store.
Practical Business Relevance
A Data Analytics Consultant uses:
-
Mean → to measure average performance
-
Median → to avoid misleading insights due to outliers
-
Mode → to understand customer preferences
These concepts are frequently asked in Data Analytics Interview Questions because they show statistical understanding behind data decisions.
Certifications aligned with global standards, such as those available through the IABAC, add strong credibility during interviews.
Preparing for Data Analytics Interview Questions requires both theoretical knowledge and practical understanding. From metrics, formulas, and regression analysis to dashboard building and cleaning messy datasets, these skills define a successful data analytics professional.
For those aiming to enhance their career, pursuing Data Analytics Certifications through platforms like the IABAC domain and understanding Data Analytics for Managers will provide a competitive advantage. With consistent practice, application of real-world examples, and thorough understanding of interview questions and answers, any aspirant can confidently excel in data analytics interviews and step into a high-demand, rewarding career.