


Data Analytics Basics: A Complete Beginner Guide
Step into the world of data analytics. Learn core concepts, tools, skills, and career opportunities with practical examples in this beginner guide.
Have you ever wondered how Netflix always knows what show you want to watch next? Or how your bank catches a suspicious transaction before you even notice it?
The answer is data analytics.
Data analytics is one of the fastest-growing and most in-demand skills in the world right now. Every industry — from healthcare to cricket, from retail to banking — needs people who can make sense of data and turn it into smart decisions.
Whether you are just starting out, already working, or running your own business, this guide is for you.
What Is Data Analytics in Simple Words?
Let's keep this as simple as possible.
Data analytics is the process of looking at information, finding patterns in it, and using those patterns to make better decisions.
That's the whole idea. Everything else — the tools, the techniques, the job titles — all sit on top of this one simple concept.
Here are some everyday examples you already relate to:
-
You check your monthly bank statement and realize you spent too much on food delivery — that's data analytics.
-
A shopkeeper notices that cold drinks sell more on weekends, so he stocks up on Fridays — that's data analytics.
-
A teacher compares student test scores to figure out which topic needs more revision — that's data analytics.
-
A fitness app tracks your steps, sleep, and calories to suggest a better daily routine — that's data analytics.
The only difference between these casual examples and professional data analytics is:
-
The size of the data being handled
-
The tools used to process it
-
The scale of the decisions being made
Data analytics is not magic. It is a structured, logical way of asking questions and finding answers using data that already exists.
Why Does Data Analytics Matter?
Here is a simple question. Would you rather run a business based on gut feelings or based on facts?
Most smart people would choose facts. That is precisely why data analytics has become so important.
The numbers back this up. According to this World Economic Forum Report, data analysts and scientists are among the top 10 most in-demand jobs globally. The global data analytics market is expected to reach $650 billion by 2029. And closer to home, data analyst roles in India have grown by over 45% in the last three years alone.
Here is how data analytics is already affecting your daily life:
-
Netflix studies what you watch, how long you watch, and when you pause — to recommend the next show you will love.
-
Amazon analyzes your browsing and purchase history to suggest products before you even search for them.
-
Zomato uses order data and location patterns to predict your delivery time accurately.
-
Banks monitor transaction patterns in real time to detect fraud the moment something looks suspicious.
-
Hospitals analyze patient history and symptoms to predict who might need urgent attention next.
For businesses, data analytics directly helps to:
-
Make faster, more confident decisions
-
Understand exactly what customers want
-
Cut costs by reducing waste and inefficiency
-
Identify risks before they turn into real problems
-
Discover new market opportunities
-
Outperform competitors who are still relying on guesswork
The demand for people with data analytics skills is not slowing down. Learning even the basics gives you a genuine edge in today's job market.
The Four Types of Data Analytics
Not all data analytics is the same. There are four main types, and each one answers a different kind of question. Understanding these is the foundation of everything else.
1. Descriptive Analytics — "What Happened?"
This is the most basic type. It looks at historical data and summarizes what took place.
Real life examples:
-
A monthly sales report showing total revenue earned last quarter
-
Your phone shows how much screen time you used this week
-
A cricket scorecard showing runs, wickets, and overs at the end of a match
Think of it as: Reading your exam results. It tells you the score — not the reason behind it.
Common tools used: Excel, Google Sheets, basic dashboards
2. Diagnostic Analytics — "Why Did It Happen?"
This goes one step deeper. Once you know what happened, diagnostic analytics helps you find out why.
Real life examples:
-
Sales dropped in March — diagnostic analytics reveal it was due to a competitor's heavy discount campaign.
-
A restaurant notices weekend footfall fell — turns out a nearby road was under construction.
-
A mobile app lost users — analysis shows the latest update had a bug on Android devices.
Think of it as: Going to the doctor and asking — "Why did my health suddenly get worse?"
Common tools used: SQL, Excel filters, data drill-down techniques
3. Predictive Analytics — "What Will Happen?"
Now things get really interesting. Predictive analytics uses past patterns to make informed predictions.
Real life examples:
-
Weather apps are predicting rain three days from now
-
An e-commerce platform is predicting which products will sell the most during a festive sale.
-
A bank is predicting which customers are at risk of defaulting on their loans.
-
Spotify is predicting the next song you will want to add to your playlist.
Think of it as: Studying previous years' exam papers to predict which chapters are most likely to appear this year.
Common tools used: Python, R, machine learning models
4. Prescriptive Analytics — "What Should We Do?"
This is the most advanced type. It doesn't just predict what might happen — it recommends the best action to take.
Real life examples:
-
Google Maps reroutes you around traffic before you even hit it.
-
An airline automatically adjusts ticket prices based on how fast seats are filling up.
-
A hospital system suggesting which patients should be prioritized for surgery based on their condition data.
Think of it as: A personal coach who doesn't just tell you that you are unfit, but hands you a specific 8-week plan to fix it.
Common tools used: AI models, optimization systems, advanced analytics platforms
How Does the Data Analytics Process Work?
Knowing the types is one thing. Knowing how the actual process works is what makes it practical. Here is a step-by-step breakdown of how a real analytics project runs:
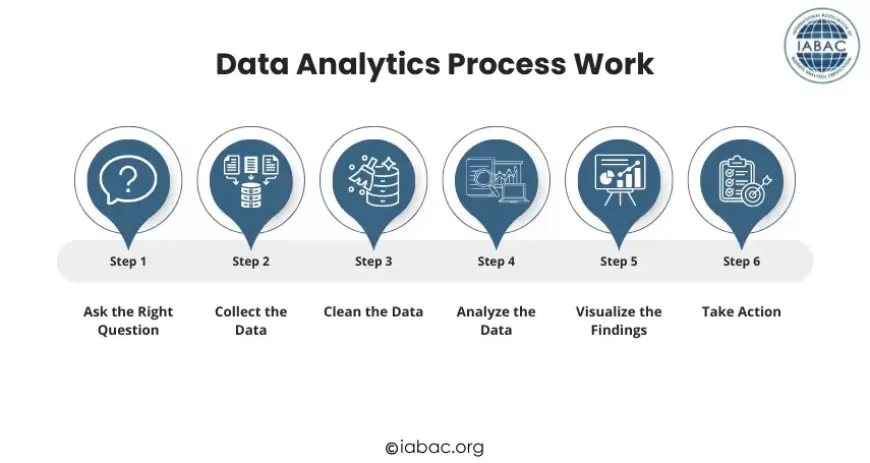
Step 1: Ask the Right Question
-
Everything starts with a clear, specific question.
-
Vague question: "Let's explore our data".
-
Good question: "Why did customer retention drop by 20% in the last quarter?".
-
A focused question keeps the entire analysis on track.
Step 2: Collect the Data
-
Gather relevant data from the right sources.
-
Sources include: sales databases, website analytics, customer surveys, social media, CRM tools, IoT devices.
-
Important: the data must actually be connected to the question you are asking.
Step 3: Clean the Data
-
Raw data is almost always messy and unreliable.
-
Problems include: duplicate entries, missing values, incorrect formats, and spelling errors.
-
This step fixes all of it before analysis begins.
-
Important fact: analysts spend 50 to 80% of their time just on this step alone.
-
Dirty data leads to wrong conclusions — no matter how smart the analysis is.
Step 4: Analyze the Data
-
Now you look for patterns, trends, and connections in the clean data.
-
You use tools, formulas, and statistical methods to make sense of what you are seeing.
-
This is the step most people picture when they imagine "doing data analytics".
Step 5: Visualize the Findings
-
Numbers on their own are hard for most people to understand.
-
You turn them into charts, graphs, and dashboards that anyone can read at a glance.
-
A great insight that nobody understands is a useless insight.
Step 6: Take Action
-
This is the most important step — and the one most people skip.
-
Analytics without action is just an expensive exercise.
-
The whole purpose is to make a better decision based on what the data revealed.
What Tools Do Data Analysts Use?
You do not need to learn all of these at once. The smart approach is to start simple, get confident, and build up gradually.
Beginner Level: Start Here:
-
Microsoft Excel / Google Sheets: The best first tools for anyone. Pivot tables, charts, VLOOKUP, and basic formulas can handle a surprising amount of real analytics work.
-
Google Analytics: Tracks website visitors and behavior. Essential for anyone going into digital marketing or e-commerce.
Intermediate Level: Build From Here:
-
SQL: Lets you pull data directly from large databases. One of the most in-demand skills in any analytics job.
-
Tableau: A drag-and-drop dashboard tool. No coding needed. Excellent for creating visual reports.
-
Power BI: Microsoft's version of Tableau. Very widely used in corporate and enterprise settings.
Advanced Level: Go Here When Ready:
-
Python: The most popular programming language for data analytics. Libraries like Pandas, NumPy, and Matplotlib make data work fast and powerful.
-
R: Preferred in research, academic, and scientific environments for deep statistical analysis.
Recommended Learning Order for Beginners: Excel → SQL → Tableau or Power BI → Python
Do not jump to Python on day one. Build your foundations first. The tools are learnable — what matters more is understanding what question you are trying to answer with them.
What Skills Do You Need to Get Started?
Data analytics requires a mix of technical skills and human skills. Both matter equally.
Technical Skills:
-
Basic math — averages, percentages, ratios, simple statistics.
-
Comfort with spreadsheets — Excel or Google Sheets.
-
Ability to read and interpret charts and graphs.
-
Basic SQL to retrieve and filter data from databases.
-
Familiarity with at least one data visualization tool.
Analytical Skills:
-
Breaking a large, complex problem into smaller, manageable parts.
-
Recognizing patterns and spotting what looks unusual or unexpected.
-
Understanding the difference between correlation and causation.
-
Asking "so what does this actually mean?" after every finding.
Communication Skills:
-
Explaining complex data findings in plain, simple language.
-
Building reports and dashboards that non-technical people can understand.
-
Presenting insights clearly and confidently to decision makers.
-
Telling a logical story with your data — not just dumping numbers.
The Right Mindset:
-
Naturally curious — you enjoy asking why.
-
Patient — especially when data is messy and incomplete.
-
Willing to be wrong and dig deeper when something doesn't add up.
-
Open to continuous learning — this field evolves quickly.
Career Paths in Data Analytics
One of the best things about building data skills is how many directions you can go from there.
Data Analyst
-
The most common entry-level role.
-
Works with data daily to generate reports, dashboards, and business insights.
-
Skills needed: Excel, SQL, Tableau or Power BI, basic statistics.
-
Industries hiring: banking, retail, healthcare, e-commerce, IT.
Business Intelligence Analyst
-
Focuses on building company-wide dashboards for senior leadership.
-
Translates data into strategic business decisions.
-
Skills needed: SQL, Power BI or Tableau, strong business understanding.
Marketing Analyst
-
Applies analytics to advertising, campaigns, and customer behavior.
-
Tracks ROI, customer acquisition costs, and campaign performance.
-
Skills needed: Google Analytics, Excel, basic SQL, marketing knowledge.
-
Builds predictive models and machine learning systems.
-
More advanced than a data analyst — requires stronger programming skills.
-
Skills needed: Python, R, machine learning, advanced statistics.
-
Builds the systems and pipelines that store and move data.
-
Less focused on analysis, more on infrastructure and architecture.
-
Skills needed: SQL, Python, cloud platforms like AWS or Azure.
The good news: You don't need to decide your exact path on day one. Start as a data analyst, build your skills and portfolio, and let your interests guide you toward a specialization over time.
Data analytics is no longer a skill only for tech experts. It belongs to everyone.
Companies across every industry are hiring people who can read data and turn it into smart decisions. The opportunity is real, and it is growing fast.
You do not need a degree to start. You do not need to know coding on day one. You just need curiosity, the right tools, and consistent practice.
Start with Excel this week. Work on one real dataset. Take it one step at a time.
If you are serious about building a career in data, consider the Data Analytics Certification a globally recognized credential designed to get you job-ready faster.
Every data expert in the world started exactly where you are right now — at zero.