


How to Use Power BI for Data Analytics?
Learn how to use Power BI for data analytics, connect data, build interactive dashboards, visualize insights, & make smarter, data-driven business decisions.

Data drives modern organizations, yet raw information alone has limited value without proper analysis. Businesses require tools that can transform scattered datasets into clear insights for decision-making. Power BI has emerged as one of the most widely adopted platforms for this purpose, enabling professionals to build reports, dashboards, and advanced analytics solutions without complex coding.
Developed by Microsoft, Power BI combines data integration, modeling, visualization, and sharing within a single ecosystem. From startups to large enterprises, teams use it to monitor performance, identify trends, forecast outcomes, and support strategic planning.
Let’s explore how to use Power BI for data analytics, covering architecture, modeling, visualization, security, and real-world applications.
What Is Power BI and Why It Matters for Modern Data Analytics
Power BI is a business intelligence platform that converts data from multiple sources into interactive visual insights. It supports the entire analytics workflow - data preparation, modeling, analysis, and reporting.
Organizations adopt Power BI because it enables:
-
Centralized data visibility
-
Interactive dashboards for real-time monitoring
-
Self-service analytics for non-technical users
-
Collaboration across teams
-
Data-driven decision processes
Power BI can connect to hundreds of data sources, including databases, cloud services, spreadsheets, and web APIs. Once data is imported, users can transform it, create relationships, and design visual reports that reveal patterns and trends.
Unlike traditional reporting tools, Power BI emphasizes exploration. Users can filter, drill down, and interact with visuals to uncover insights dynamically rather than viewing static charts.
Also Read: How to Start a Career in Data Analytics
Power BI Architecture: Desktop, Service, Mobile, and Gateway
Understanding the architecture helps users deploy Power BI effectively across organizations.
Power BI Desktop is the primary development environment where analysts:
-
Connect to data sources
-
Clean and transform data using Power Query
-
Build data models
-
Create visual reports
It functions as the foundation for most analytics workflows.
Power BI Service (Cloud Platform)
After creating reports in Desktop, they can be published to the cloud-based Power BI Service. This platform enables:
-
Sharing dashboards across teams
-
Scheduled data refresh
-
Collaboration through workspaces
-
Real-time dashboards and alerts
-
Web access without local installation
The service also supports embedding analytics into business applications and distributing content securely.
Power BI Mobile
Mobile applications allow users to monitor dashboards from smartphones and tablets. Executives often rely on mobile access for tracking KPIs and operational metrics while away from the office.
On-Premises Data Gateway
Organizations frequently store data within internal networks. The gateway enables secure communication between local data sources and the cloud service without moving sensitive information.
It supports scheduled refreshes, live connections, and secure data transfer through encrypted channels.
Together, these components form a complete analytics ecosystem spanning development, deployment, and consumption.
Getting Started: Power BI Tutorial for Beginners and Professionals
Power BI Workflow: Install Desktop → Connect Data → Clean Data → Model Data → Create Visuals → Publish → Share
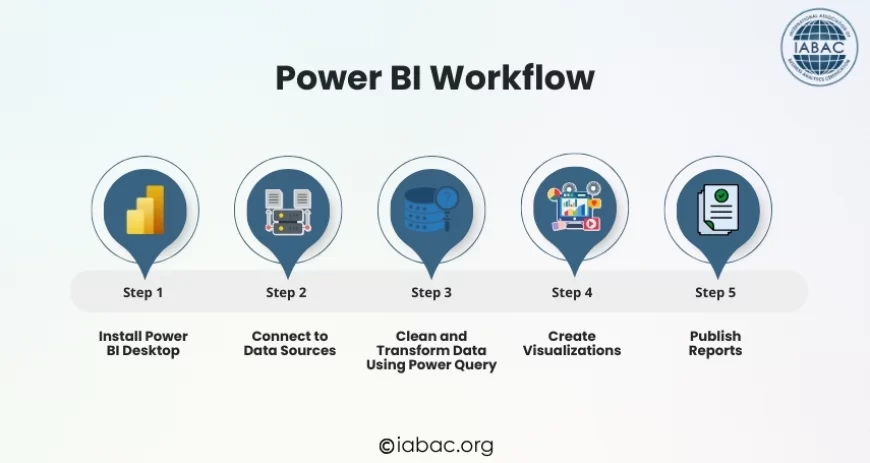
Install Power BI Desktop
Download and install Power BI Desktop from Microsoft’s official website. The software is free for individual use and suitable for learning as well as professional projects.
Connect to Data Sources
Power BI supports diverse inputs, including:
-
Excel and CSV files
-
SQL and NoSQL databases
-
Cloud platforms
-
Enterprise systems
-
Web data
The ability to integrate multiple sources allows organizations to consolidate information from across departments.
Clean and Transform Data Using Power Query
Raw data often contains inconsistencies, duplicates, or missing values. Power Query enables users to:
-
Remove errors
-
Change data types
-
Merge datasets
-
Filter irrelevant records
-
Reshape tables
These transformations prepare data for accurate analysis.
Create Visualizations
Users can build charts, maps, tables, and KPI indicators through drag-and-drop interfaces. Interactive elements such as filters and slicers allow viewers to explore data dynamically.
Publish Reports
Reports can be shared through the Power BI Service, enabling teams to access dashboards through browsers or mobile devices.
Power BI Data Modeling: Turning Raw Data into Meaningful Insights
Data modeling is central to analytics effectiveness. It organizes datasets so that calculations and relationships reflect real business scenarios.
Power BI models store transformed data in memory using optimized structures designed for analytical queries.
Relationships Between Tables
Analysts define relationships between tables to connect related datasets, such as linking sales records to customer information. Proper relationships enable cross-filtering across visuals.
Measures and Calculated Columns
Power BI uses DAX (Data Analysis Expressions) to create custom calculations.
-
Calculated columns compute values row by row
-
Measures calculate aggregated results dynamically
Examples include revenue totals, growth percentages, and performance ratios.
Schema Design
Efficient models often use star schema structures, separating fact tables from dimension tables. This design improves performance and simplifies analysis.
A well-designed model ensures accuracy, speed, and scalability for large datasets.
Creating Interactive Reports and Dashboards in Power BI
Reports and dashboards transform analytical results into visual stories that stakeholders can understand quickly.
Reports vs Dashboards
-
Reports contain multiple pages of detailed visuals
-
Dashboards present high-level summaries on a single screen
Dashboards often combine elements from several reports to provide an executive overview.
Designing Effective Visualizations
Power BI offers numerous visualization types:
-
Bar and line charts for trends
-
Pie charts for proportions
-
Maps for geographic analysis
-
Tables and matrices for detailed data
-
KPI cards for performance indicators
Interactive features such as drill-down and cross-filtering allow users to explore insights from different perspectives.
Publishing and Sharing
Reports published to the Power BI Service can be shared with teams, embedded in portals, or distributed as apps for controlled access.
Advanced Analytics with DAX and AI Capabilities
Power BI supports advanced analysis beyond descriptive reporting.
Time Intelligence
DAX functions enable calculations such as:
-
Year-over-year growth
-
Month-to-date totals
-
Rolling averages
-
Seasonal comparisons
These metrics are essential for financial and operational analysis.
Forecasting and Trend Analysis
Power BI can project future values based on historical data, assisting in planning and resource allocation.
AI Features
Built-in AI capabilities help uncover patterns automatically. Users can perform clustering, anomaly detection, and predictive analysis without specialized machine learning expertise.
Integration with Python and R
Advanced users can incorporate scripts from Python or R to perform statistical modeling and custom visualizations.
Power BI Performance Optimization Techniques
As datasets grow, performance becomes critical.
Key optimization practices include:
-
Removing unnecessary columns
-
Aggregating data appropriately
-
Designing efficient relationships
-
Choosing suitable storage modes
-
Minimizing complex calculations
Power BI supports both imported datasets and live connections. Selecting the right approach balances speed with real-time accuracy.
Efficient models reduce memory usage and improve report responsiveness.
Data Security, Governance, and Row-Level Security
Analytics systems often contain sensitive information. Power BI includes enterprise-grade security features.
Role-Based Access Control
Administrators can restrict access to reports based on user roles.
Row-Level Security (RLS)
RLS ensures users see only data relevant to them. For example, regional managers can view results for their territories while executives access organization-wide data.
Power BI integrates with identity management systems to enforce authentication and authorization policies.
Compliance and Privacy
Organizations can apply sensitivity labels, audit logs, and governance policies to meet regulatory requirements.
Real-World Business Intelligence Use Cases of Power BI
Power BI supports analytics across industries and functions.
Sales Performance Analysis
Track revenue trends, product performance, and customer behavior to improve sales strategies.
Marketing Analytics
Evaluate campaign effectiveness, conversion rates, and customer acquisition costs.
Financial Reporting
Monitor profitability, expenses, forecasts, and variance analysis.
Supply Chain Monitoring
Analyze inventory levels, logistics efficiency, and supplier performance.
Human Resources Analytics
Assess workforce trends, attrition rates, and productivity indicators.
These use cases demonstrate how analytics transforms operational data into strategic insights.
Power BI Compared with Other BI Tools
Organizations often evaluate multiple platforms before adoption.
Compared with tools such as Tableau, Google Looker Studio, and Qlik Sense, Power BI stands out for its integration with Microsoft ecosystems, affordability, and strong data modeling capabilities.
|
Tool |
Strength |
Best For |
Learning Curve |
|
Power BI |
Integration + modeling |
Enterprises |
Moderate |
|
Tableau |
Visual exploration |
Data specialists |
Moderate - High |
|
Looker Studio |
Web reporting |
Marketing teams |
Low |
|
Qlik Sense |
Associative analytics |
Large datasets |
Moderate |
Power BI provides a balanced combination suitable for both technical analysts and business users.
Limitations of Power BI to Consider
While powerful, Power BI has constraints that organizations should evaluate:
-
Advanced DAX calculations require learning effort
-
Very large datasets may need premium infrastructure
-
Real-time analytics depends on data source configuration
-
Complex models demand careful design
Understanding these factors helps teams plan implementations effectively.
Best Practices for Data Visualization Using Power BI
Effective dashboards communicate insights clearly.
Recommended practices include:
-
Selecting chart types appropriate to the data
-
Maintaining consistent color schemes
-
Highlighting key metrics
-
Avoiding clutter
-
Providing context through labels and annotations
-
Designing layouts for readability
Visualization should support decision-making rather than overwhelm viewers with excessive information.
The Future of Business Intelligence with Power BI
Business intelligence continues to evolve toward automation and predictive insights. Power BI is expanding in areas such as:
-
AI-assisted analytics
-
Real-time monitoring systems
-
Embedded analytics within applications
-
Integration with enterprise data platforms
Organizations that adopt data-driven practices gain advantages in agility, efficiency, and strategic planning.
Power BI has become a cornerstone of modern data analytics by combining data preparation, modeling, visualization, and sharing within a unified platform. From beginner projects to enterprise deployments, it supports the full spectrum of analytical needs.
Professionals who develop strong Power BI skills can transform complex datasets into meaningful insights that drive business performance. As organizations continue to rely on data for competitive advantage, expertise in tools like Power BI remains highly valuable.
For individuals seeking to build or validate these capabilities, structured training and recognized certifications provide a clear pathway to career growth.
Explore globally recognized data analytics programs from International Association of Business Analytics Certifications to strengthen your expertise in data analytics, business intelligence, and modern decision-making skills.