Types of Analytics in Data Analysis
Understand the main types of analytics in data analysis, including descriptive, diagnostic, predictive, and prescriptive analytics with clear use cases.

Data is collected every second. Websites track visitors. Apps record clicks. Stores track purchases. Banks record transactions. Hospitals store patient records. Companies save employee data. But collecting data is only the first step. The real value begins when this data is analyzed in the right way.
This is where the Types of Analytics play a very important role.
Many people learn tools like Excel, SQL, Power BI, or Python. They build dashboards and reports. But without understanding the types of analytics, they often do not know what question they are trying to answer with the data.
In data analysis, analytics is not random. It follows a clear order. This order helps businesses understand the past, find reasons behind problems, predict what may happen next, and decide the best action to take.
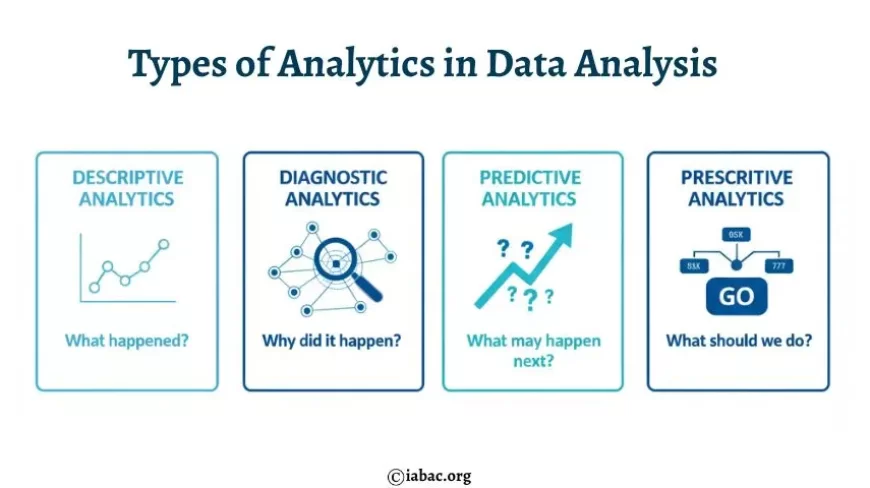
These are the four main types:
- Descriptive Analytics – What happened?
- Diagnostic Analytics – Why did it happen?
- Predictive Analytics – What may happen next?
- Prescriptive Analytics – What should we do?
This structure is used across industries and is a key concept taught in many Data Analytics Certifications and Data Analytics for Managers programs because it builds strong analytical thinking.
Understanding the Flow of Analytics
Think of analytics like a story.
First, you read what happened. Then you ask why it happened. After that, you try to see what could happen next. Finally, you decide what action to take.
Most organizations follow this exact flow daily without even realizing it. Every report, every dashboard, every business decision is connected to one of these types.
When these four types are used together, data becomes a powerful decision-making tool instead of just numbers on a screen.
Descriptive Analytics – What Happened?
Descriptive analytics is the foundation of data analysis. It summarizes past data and presents it in a simple way.
It answers: What happened?
Examples:
- How many products were sold last month?
- How many visitors came to the website yesterday?
- What was the total revenue last quarter?
- How many support tickets were raised this week?
These are simple questions, but they are very important. Almost every dashboard you see in a company is based on descriptive analytics.
Common Tools
- Excel
- SQL
- Power BI
- Tableau
- Google Analytics
Common Metrics
- Sales count
- Revenue
- Website traffic
- Conversion rate
- Customer count
- Profit margin
More than 70% of business reports used by teams and managers are descriptive reports. Without this step, no further analysis is possible.
Diagnostic Analytics – Why Did It Happen?
Once the numbers are clear, the next step is to understand the reason behind them.
This is diagnostic analytics.
It answers: Why did it happen?
Examples:
- Why did sales drop in one region?
- Why are customers leaving after a free trial?
- Why did website traffic increase after a campaign?
- Why is one product getting more returns?
Diagnostic analytics compares data, filters information, and finds patterns.
Techniques Used
- Data filtering
- Drill-down reports
- Comparisons between time periods
- Root cause analysis
- Correlation checks
Metrics Used
- Churn rate
- Complaint rate
- Engagement rate
- Product return rate
This type is widely used in marketing, customer experience, and operations teams where understanding the reason is critical.
Predictive Analytics – What May Happen Next?
After understanding the past and its reasons, businesses want to prepare for the future.
Predictive analytics answers: What is likely to happen next?
It uses past data along with statistics and machine learning models to forecast outcomes.
Examples:
- Predicting next month’s sales
- Predicting which customers may leave
- Predicting loan default risk
- Predicting product demand
- Predicting patient health risks
Techniques Used
- Regression analysis
- Forecasting models
- Machine learning algorithms
- Time series analysis
Metrics Used
- Forecast accuracy
- Risk score
- Probability value
- Demand estimate
Organizations using predictive analytics report up to 20–30% better planning accuracy because they prepare before problems happen.
Prescriptive Analytics – What Should We Do?
This is the most advanced type of analytics.
It answers: What action should be taken?
Prescriptive analytics suggests the best decision based on predictions.
Examples:
- Which customers should receive discounts?
- How much stock should be ordered?
- What price should be set for a product?
- Which delivery route saves more fuel?
Techniques Used
- Optimization models
- Decision analysis
- AI-based recommendations
- Simulation models
Metrics Used
- Cost reduction
- Profit improvement
- Time saved
- Resource efficiency
Prescriptive analytics turns data into action plans.
Which Type of Analytics Is Most Used in Data Analysis
The most commonly used type is Descriptive Analytics.
Every organization, small or large, uses reports and dashboards daily. These are descriptive in nature.
However, organizations that go beyond descriptive analytics and use diagnostic and predictive analytics gain a major advantage. They do not just see numbers; they understand reasons and prepare for the future.
The best results come when all four types are used together.
Role of Types of Analytics in Modern Data Analysis
In modern organizations, decisions are rarely made without data. These types of analytics guide decision-making in every department.
Marketing
- Descriptive: Campaign performance
- Diagnostic: Why ads failed
- Predictive: Customer buying behavior
- Prescriptive: Best audience to target
Finance
- Descriptive: Expense reports
- Diagnostic: Profit decrease reasons
- Predictive: Fraud detection
- Prescriptive: Investment choices
Healthcare
- Descriptive: Patient records
- Diagnostic: Disease patterns
- Predictive: Health risk prediction
- Prescriptive: Treatment planning
E-commerce
- Descriptive: Sales dashboard
- Diagnostic: Cart abandonment reasons
- Predictive: Product demand
- Prescriptive: Product recommendations
This is why Data Analytics for Managers is becoming essential. Managers must understand how to ask the right analytical questions.
How to Learn the Types of Analytics in Data Analysis
Learning analytics should follow the same order as the types.
Step 1: Start with Descriptive Analytics
Learn:
- Excel
- Basic SQL
- Dashboards
- Reporting
Step 2: Move to Diagnostic Analytics
Learn:
- Data comparison
- Filters
- Root cause thinking
- Advanced SQL queries
Step 3: Learn Predictive Analytics
Learn:
- Basic statistics
- Python or R
- Forecasting methods
- Machine learning basics
Step 4: Learn Prescriptive Analytics
Learn:
- Decision models
- Optimization logic
- AI tools
Many learners choose Data Analytics Certifications because they cover all these types with practical examples.
Real Business Example Using All Four Types
An online store notices a drop in sales.
- Descriptive: Sales dropped by 25% last month.
- Diagnostic: Mobile users faced slow loading speed.
- Predictive: Traffic will continue to drop if not fixed.
- Prescriptive: Improve mobile speed and run mobile-focused ads.
This is how analytics works in real business situations.
Common Metrics Used Across Analytics
|
Area |
Important Metrics |
|
Marketing |
CTR, Conversion Rate, ROI, CAC |
|
Sales |
Revenue, Growth Rate, Average Order Value |
|
Customer |
Churn Rate, Retention Rate, NPS |
|
Finance |
Profit Margin, Expense Ratio |
|
Operations |
Efficiency Rate, Downtime, Throughput |
These metrics are analyzed using the four types of analytics.
Why Understanding Types of Analytics Is Important
Without knowing the types:
- Reports are created without purpose
- Data is collected without direction
- Tools are used without clear goals
When the types are understood, data analysis becomes structured and meaningful.
Where These Types Are Used
- Banking and Finance
- Healthcare
- Retail and E-commerce
- Education
- Manufacturing
- IT and Software
- Logistics
Analytics is now part of daily decision-making everywhere.
Why Types of Analytics Matter for Career Growth
Understanding the types of analytics is not only about theory. It directly impacts career growth. Many professionals struggle not because they lack tools, but because they do not know which type of analytics to apply at the right time.
When someone understands descriptive, diagnostic, predictive, and prescriptive analytics clearly, they:
- Ask better business questions
- Build meaningful dashboards
- Explain insights confidently
- Support decisions instead of just sharing numbers
Organizations prefer professionals who can connect data with decisions, not just create charts. This is one reason why analytics roles continue to grow across industries.
Types of Analytics and Decision-Making Power
Analytics is not just for analysts. Decision-makers rely on analytics every day, often without realizing it.
- Descriptive analytics supports status checks
- Diagnostic analytics supports problem-solving
- Predictive analytics supports planning
- Prescriptive analytics supports action-taking
When these types are missing or misunderstood, decisions become reactive instead of planned. This leads to higher costs, missed opportunities, and slow growth.
Why Managers Need to Understand Types of Analytics
Many managers receive reports but feel unsure about what to do next. This happens when reports show numbers without context.
This is where Data Analytics for Managers becomes important.
Managers who understand analytics types can:
- Question reports correctly
- Ask “why” instead of accepting numbers
- Request better insights from teams
- Make confident decisions using data
Managers do not need to write code, but they must understand how analytics supports decisions.
Connection Between Types of Analytics and Business Metrics
Metrics alone do not give value. Analytics gives meaning to metrics.
For example:
- Revenue growth (descriptive)
- Reason for growth or decline (diagnostic)
- Expected revenue next quarter (predictive)
- Pricing or sales strategy decision (prescriptive)
Without analytics types, metrics remain isolated numbers. With analytics, metrics become decision tools.
How Types of Analytics Are Taught in Data Analytics Certifications
Most structured Data Analytics Certifications are designed around these four types of analytics.
They focus on:
- Real business problems
- Industry-based case studies
- Metric-driven analysis
- Tool usage linked to decision-making
Certifications help learners move from basic reporting to advanced thinking. They also help in understanding how analytics is used in real companies, not just in theory.
Common Mistakes When Learning Analytics Types
Many learners face problems because of these mistakes:
- Jumping directly to tools without understanding analytics types
- Creating dashboards without knowing the question
- Using predictive models without strong descriptive analysis
- Ignoring business context
Avoiding these mistakes makes learning smoother and more practical.
Reality of Learning Analytics
Learning analytics can feel confusing at first. Numbers may look overwhelming. Reports may feel meaningless. Many people doubt whether they are “good with data.”
But once the types of analytics become clear, something changes.
Data stops feeling scary.
Reports start making sense.
Questions become clearer.
Confidence slowly builds.
This change is why analytics skills feel rewarding over time.
Why Types of Analytics Are Future-Proof Skills
Tools change. Technologies change. Job titles change.
But the types of analytics do not change.
No matter which tool is used—Excel, Power BI, Python, or AI platforms—the logic of analytics stays the same:
- Understand the past
- Find the reason
- Prepare for the future
- Decide the action
This makes analytics a long-term, reliable skill across careers.
How Types of Analytics Create a Complete Data Mindset
When someone understands all four types, they develop a strong data mindset:
- They stop reacting and start planning
- They move from guessing to knowing
- They communicate insights clearly
- They add value in meetings and discussions
This mindset is what separates average reporting from meaningful analysis.
The Types of Analytics are not separate topics. They are connected steps of one process.
When used together, data becomes more than information.
It becomes guidance.
It becomes confidence.
It becomes a support system for better decisions.
You can now insert these sections smoothly into your existing blog to remove gaps and improve depth without rewriting the entire article.
The Types of Analytics provide a clear path for working with data:
- Look at what happened
- Understand why it happened
- See what may happen next
- Decide what action to take
This approach turns raw data into useful insights.
Whether working in analytics, marketing, finance, operations, or management, understanding these types builds a strong foundation. With proper learning and the support of Data Analytics Certifications, anyone can learn how to apply analytics in real situations.
When you understand the types of analytics, every dataset starts making sense, and every number begins to tell a story.