


What are the Main data analytics types used in Business?
Learn the main data analytics types used in business, including descriptive, diagnostic, predictive, and prescriptive analytics for better decisions.
Data is generated everywhere. Every website visit, product purchase, mobile app interaction, or online search creates valuable information. Businesses collect this data not just to store it, but to understand patterns, make smarter decisions, and improve customer experiences.
This is where data analytics becomes essential.
Companies today rely on analytics to answer important business questions such as:
- Why did sales decline last month?
- Which marketing campaigns work best?
- What products will customers buy next?
- Which customers are likely to stop using our service?
By analyzing data, organizations transform raw numbers into meaningful insights that guide strategic decisions.
However, not all data analysis works the same way. In business, analytics is typically divided into four major types, each answering a different type of question.
These four categories form the foundation of modern data-driven decision making:
- Descriptive Analytics
- Diagnostic Analytics
- Predictive Analytics
- Prescriptive Analytics
Understanding these analytics types helps businesses move from simply observing past events to making intelligent future decisions.
Understanding Data Analytics in Business
Before diving into the four types, it is important to understand what data analytics really means.
Data analytics is the process of collecting, organizing, analyzing, and interpreting data to discover useful insights.
Organizations use analytics to:
- Identify trends and patterns
- Improve operational efficiency
- Understand customer behavior
- Forecast future outcomes
- Make data-driven decisions
For example, an online retail company might analyze its customer data to discover:
- Which products sell the most
- Which marketing channels generate the most sales
- When customers are most active
- Why customers abandon shopping carts
Without analytics, businesses would rely on guesswork. With analytics, they can rely on evidence and insights.
The Four Main Types of Data Analytics
The four analytics types represent different levels of data analysis maturity. Each type answers a specific business question.
|
Analytics Type |
Key Question |
Focus |
|
Descriptive Analytics |
What happened? |
Past data |
|
Diagnostic Analytics |
Why did it happen? |
Cause analysis |
|
Predictive Analytics |
What might happen? |
Future forecasting |
|
Prescriptive Analytics |
What should we do? |
Decision optimization |
Let’s explore each of them in detail.
1. Descriptive Analytics – Understanding What Happened
Descriptive analytics is the most basic and widely used form of data analysis.
It focuses on summarizing historical data to answer the question:
What happened?
Organizations use descriptive analytics to convert raw data into meaningful summaries such as reports, dashboards, and key performance indicators.
Example
Consider a company analyzing its monthly sales:
- January Sales: $10,000
- February Sales: $8,000
Descriptive analytics simply tells us that sales decreased by $2,000.
It does not explain the reason behind the drop, but it clearly shows what occurred.
Common Metrics Used
Businesses track several metrics using descriptive analytics:
- Total revenue
- Customer acquisition numbers
- Website traffic
- Sales volume
- Conversion rate
- Average order value
Example Calculation: Conversion Rate
Conversion rate measures the percentage of visitors who complete a desired action, such as making a purchase.
Conversion Rate = (Number of Sales ÷ Total Visitors) × 100
If:
- Website Visitors = 1000
- Purchases = 50
Conversion Rate = (50 ÷ 1000) × 100
Conversion Rate = 5%
This means 5% of visitors became customers.
Common Tools Used
Businesses often use the following tools for descriptive analytics:
- Microsoft Excel
- SQL databases
- Power BI
- Tableau
- Google Analytics
These tools allow analysts to build dashboards that summarize data visually.
Why Descriptive Analytics Matters
Descriptive analytics provides organizations with clear visibility into past performance. It acts like a rear-view mirror, showing what has already happened.
While it cannot explain causes or predict the future, it forms the foundation for deeper analysis.
2. Diagnostic Analytics – Understanding Why It Happened
After identifying what happened, the next logical question is:
Why did it happen?
This is where diagnostic analytics comes in.
Diagnostic analytics investigates relationships within data to determine the root causes of trends or anomalies.
Example
Continuing the earlier example:
Sales dropped from $10,000 to $8,000.
Diagnostic analysis might reveal:
- Website traffic dropped by 30%
- A popular product was out of stock
- A competitor launched a major discount campaign
Now the business understands why sales decreased.
Techniques Used in Diagnostic Analytics
Analysts use several techniques to identify causes, including:
- Data drilling – examining data in deeper detail
- Correlation analysis – identifying relationships between variables
- Root cause analysis
- Data segmentation
- Variance analysis
Correlation Example
Correlation measures how strongly two variables are related.
The correlation coefficient (r) ranges from -1 to +1.
|
Value |
Meaning |
|
+1 |
Strong positive relationship |
|
0 |
No relationship |
|
-1 |
Strong negative relationship |
Example:
If advertising spending decreases and sales also decrease, they may be positively correlated.
If the correlation coefficient is:
r = 0.8
This indicates a strong positive relationship between advertising and sales.
Why Diagnostic Analytics Matters
Diagnostic analytics helps organizations move beyond simple observations.
Instead of guessing the cause of a problem, businesses can identify the exact factors affecting performance.
This leads to better and more targeted decisions.
3. Predictive Analytics – Forecasting What Might Happen
Predictive analytics focuses on the future.
It answers the question:
What is likely to happen next?
Predictive analytics uses historical data, statistical models, and machine learning algorithms to forecast future outcomes.
Example
Suppose an online store notices a pattern:
Customers who buy running shoes often return within 30 days to buy sports accessories.
Using predictive analytics, the company predicts that new shoe buyers are likely to make another purchase soon.
The business can then target these customers with promotions.
Techniques Used
Predictive analytics uses advanced analytical techniques such as:
- Machine learning algorithms
- Regression analysis
- Time series forecasting
- Classification models
- Predictive modeling
Simple Regression Example
Regression analysis helps predict how one variable affects another.
Example relationship:
Sales = a + b(Ad Spend)
Where:
- a = base sales
- b = impact of advertising
If:
- a = 2000
- b = 5
- Advertising Spend = 1000
Sales = 2000 + (5 × 1000)
Sales = 7000
The model predicts $7,000 in sales.
Real-World Applications
Many global companies rely heavily on predictive analytics:
- Netflix recommends movies based on viewing history
- Amazon suggests products that customers may buy
- Banks predict loan default risks
- Airlines forecast ticket demand
Why Predictive Analytics Matters
Predictive analytics allows companies to anticipate future trends instead of reacting too late.
This enables:
- proactive decision making
- improved customer targeting
- better risk management
4. Prescriptive Analytics – Deciding What Should Be Done
Prescriptive analytics represents the most advanced level of analytics.
It answers the question:
What action should we take?
Prescriptive analytics combines predictive models with optimization algorithms and decision models to recommend the best course of action.
Example
Suppose predictive analytics identifies customers with an 80% probability of leaving a service.
Prescriptive analytics might recommend actions such as:
- offering a loyalty discount
- sending personalized promotions
- improving customer support
Business Decision Example
Assume:
- Customer churn probability = 80%
- Cost to retain customer = $10
- Average customer revenue = $100
Since retaining the customer costs far less than losing them, the system recommends retention strategies.
Techniques Used
Prescriptive analytics often involves:
- Optimization algorithms
- Artificial intelligence systems
- Simulation models
- Decision analysis
These systems help businesses choose the best possible decision among multiple options.
Why Prescriptive Analytics Matters
Prescriptive analytics transforms insights into clear actions.
Instead of just understanding data, businesses can automatically generate recommendations that improve performance.
How the Four Types Work Together
The four analytics types are not independent—they often work together in a sequence.
A typical business analysis process might look like this:
- Descriptive Analytics: Sales dropped by 20%.
- Diagnostic Analytics: The drop happened because advertising decreased.
- Predictive Analytics: Sales may decline further next month if advertising remains low.
- Prescriptive Analytics: Increase advertising budget and launch a promotional campaign.
This step-by-step process allows organizations to move from understanding past performance to making intelligent decisions for the future.
Tools Commonly Used in Data Analytics
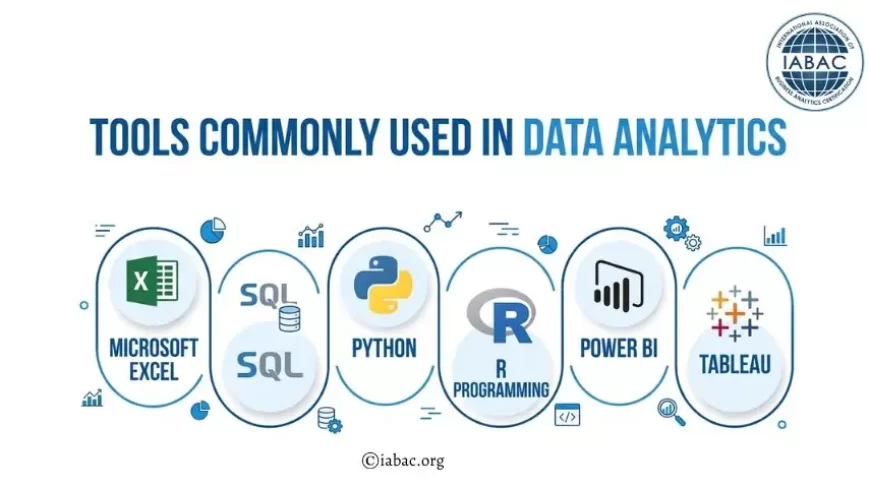
Professionals in analytics roles often work with a combination of tools such as:
- Microsoft Excel
- SQL
- Python
- R programming
- Power BI
- Tableau
Each tool helps analysts perform different tasks including data cleaning, visualization, modeling, and reporting.
Common Mistakes Beginners Make in Data Analytics
Many beginners entering analytics roles encounter similar challenges.
Some common mistakes include:
- Focusing only on tools instead of understanding concepts
- Ignoring data quality issues
- Using complex models when simple analysis is sufficient
- Forgetting the business context behind the data
Successful analysts focus not only on technical skills but also on business problem-solving.
Why Learning Data Analytics Is Important Today
Data analytics skills are in high demand across industries.
Organizations are actively hiring professionals such as:
- Data Analysts
- Business Analysts
- Data Scientists
- Analytics Consultants
Studies show that data-driven organizations are significantly more profitable and efficient.
Companies value professionals who can:
- analyze complex data
- explain insights clearly
- support strategic decisions
As businesses become increasingly digital, analytics expertise is becoming a core professional skill.
Data tells powerful stories about customers, markets, and business performance. However, these stories are often hidden within massive datasets.
The purpose of analytics is to discover these insights and transform them into meaningful actions.
By understanding the four types of analytics, businesses can move step by step:
- Identify what happened
- Understand why it happened
- Predict what may happen next
- Decide the best course of action
This structured approach allows organizations to shift from reactive decision-making to proactive strategy. Ultimately, data analytics is not just about numbers—it is about understanding behavior, improving experiences, and making smarter decisions in an increasingly data-driven world.