


What Are the Most Common Data Analyst Interview Questions
Prepare for data analyst interviews with common questions on SQL, statistics, data cleaning, visualization, and problem solving used by hiring teams.

You finally get that email: “We would like to schedule your interview.”
For a moment, life feels perfect. Then comes the next thought… “What are they going to ask me?”
Welcome to the world of data analyst interview questions, where one moment you are confidently talking about Excel, and the next moment someone asks about standard deviation, and your brain quietly logs out. Do not worry. This guide will walk you through the most common data analyst interview questions, explain how to answer them, and show simple examples (yes, even the math part). If you are preparing for a role in Data Analytics, this will help you feel more ready and less stressed.
Also, many professionals today strengthen their preparation through Data Analytics Certifications like the Certified Data Analyst programs available on platforms such as the International Association of Business Analytics Certifications (you may have seen iabac.org). These certifications help build both confidence and real-world skills.
Let’s get into the questions that interviewers love to ask.
Why Interviewers Ask These Questions
Interviewers are not trying to confuse you (even if it feels like it). They usually want to check three things:
- Can you understand data?
- Can you explain insights clearly?
- Can you solve real business problems?
In simple words, they want someone who can turn messy data into useful answers without creating more confusion.
1. Tell Me About Yourself (The “Start Strong” Question)
What they expect:
A short summary of your skills, experience, and interest in Data Analytics.
Example Answer:
“I have a strong interest in data and problem-solving. I have worked with tools like Excel, SQL, and Python to analyze datasets and create reports. Recently, I completed projects on sales analysis and customer behavior. I am also working towards a Certified Data Analyst credential to improve my practical knowledge. I enjoy finding patterns in data and helping businesses make better decisions.”
Tip: Keep it short, relevant, and focused on analytics.
2. What Is Data Analytics?
Simple Answer:
Data analytics is the process of collecting, cleaning, and studying data to find useful insights that help in decision-making.
Add Value:
You can mention types:
- Descriptive (what happened)
- Diagnostic (why it happened)
- Predictive (what might happen)
- Prescriptive (what to do next)
3. What Are the Steps in a Data Analysis Process?
Answer:
- Data collection
- Data cleaning
- Data exploration
- Data analysis
- Data visualization
- Reporting insights
Example:
If you are analyzing sales data:
- Collect sales records
- Remove duplicate entries
- Study trends
- Create charts
- Present findings
4. Explain Data Cleaning (Very Important Question)
This is where many candidates lose confidence.
Answer:
Data cleaning means fixing or removing incorrect, missing, or duplicate data.
Example:
|
Name |
Age |
|
A |
25 |
|
B |
NULL |
|
A |
25 |
Here:
- Remove duplicate row
- Fill missing age (maybe with average)
Simple Math Example:
If ages are 20, 25, 30
Average = (20 + 25 + 30) / 3 = 25
You can replace the missing value with 25.
5. What Is the Difference Between Structured and Unstructured Data?
Answer:
- Structured data: Organized (Excel, databases)
- Unstructured data: Not organized (emails, videos, images)
Example:
- Excel sheet = structured
- Social media comments = unstructured
6. What Is SQL and Why Is It Used?
Answer:
SQL (Structured Query Language) is used to manage and query data in databases.
Example Query:
SELECT name, sales
FROM customers
WHERE sales > 5000;
This shows customers with sales greater than 5000.
7. Explain Mean, Median, and Mode
This is a classic question.
Example Dataset:
10, 20, 20, 30, 40
- Mean = (10+20+20+30+40)/5 = 24
- Median = middle value = 20
- Mode = most frequent = 20
Tip: Interviewers love this because it checks basic understanding.
8. What Is Standard Deviation? (Don’t Panic)
Simple Answer:
It measures how spread out the data is.
Example:
If values are close → low deviation
If values are far apart → high deviation
Formula:
σ = √(Σ(x - mean)² / n)
You do not always need to calculate it fully. Just explain the concept clearly.
9. How Do You Handle Missing Data?
Answer:
- Remove rows
- Fill with mean/median
- Use prediction methods
Example:
If salary is missing, you can replace it with average salary.
10. What Is Data Visualization?
Answer:
Presenting data using charts and graphs.
Example:
- Bar chart for sales
- Line chart for trends
- Pie chart for percentage
Why Important:
People understand visuals faster than tables.
11. Explain a Project You Worked On
This is your chance to shine.
Example Answer:
“I worked on a sales dataset where I analyzed monthly performance. I cleaned the data, removed duplicates, and created dashboards using Excel. I found that sales increased by 25 percent during festive months. This helped in planning marketing campaigns.”
Add numbers. Numbers impress interviewers.
12. What Tools Do You Use?
Common Tools:
- Excel
- SQL
- Python
- Power BI
- Tableau
You can also mention learning platforms like iabac.org for Data Analytics Certifications.
13. What Is a KPI?
Answer:
A key performance indicator is a metric used to measure success.
Example:
- Sales revenue
- Customer retention rate
- Website traffic
14. What Is Correlation?
Answer:
It shows the relationship between two variables.
Example:
- More ads → more sales (positive correlation)
- More price → less demand (negative correlation)
15. Case-Based Question (Real Thinking Test)
Question:
Sales dropped last month. What will you do?
Answer Approach:
- Check data accuracy
- Compare previous months
- Analyze regions/products
- Identify patterns
- Suggest solutions
Interviewers love structured thinking.
16. Basic Graph Example
Imagine sales data:
|
Month |
Sales |
|
Jan |
100 |
|
Feb |
120 |
|
Mar |
90 |
A line graph would show:
- Growth from Jan to Feb
- Drop in March
Insight: Something changed in March.
17. Behavioral Questions
These test your personality.
Example:
- How do you handle deadlines?
- Have you worked in a team?
Tip:
Use real examples and keep answers simple.
18. Why Should We Hire You?
Example Answer:
“I have strong analytical skills, hands-on experience with tools, and a clear understanding of business problems. I am also improving my knowledge through Certified Data Analyst programs and real projects. I can turn data into meaningful insights.”
How Certifications Help in Interviews
Many candidates today are improving their chances by earning Data Analytics Certifications.
Programs like Certified Data Analyst offered by the International Association of Business Analytics Certifications help in:
- Learning real-world skills
- Building practical projects
- Gaining industry recognition
- Increasing job opportunities
Recruiters often prefer candidates who show both skills and certification.
Common Mistakes to Avoid
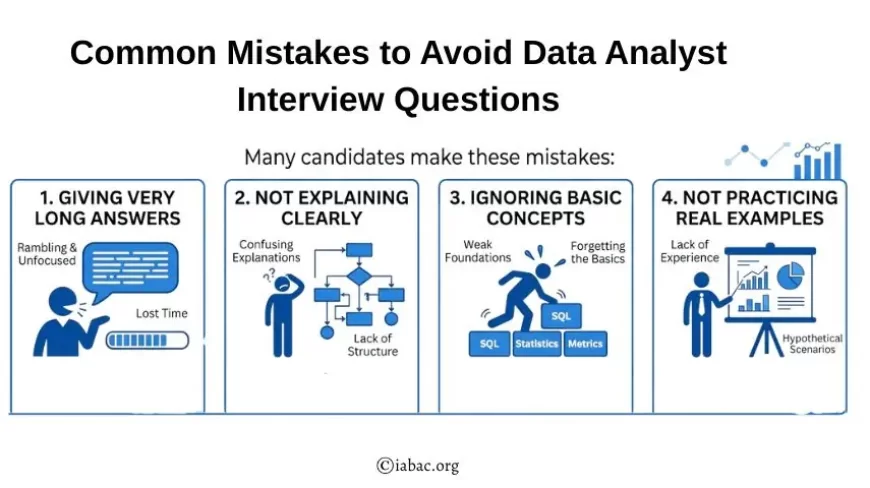
Let’s be honest. Many candidates make these mistakes:
- Giving very long answers
- Not explaining clearly
- Ignoring basic concepts
- Not practicing real examples
And the biggest one:
Trying to memorize everything instead of understanding.
Preparing for data analyst interview questions does not have to feel stressful. Once you understand the basics and practice real examples, things become easier. The field of Data Analytics is growing fast, and companies are always looking for people who can work with data and explain insights clearly. Adding strong skills and earning recognized Data Analytics Certifications like Certified Data Analyst can give you an extra advantage.
So next time you see that interview email, take a deep breath, review these questions, and walk into the interview with confidence. And if your brain still freezes for a second during the interview… just remember, even experienced analysts sometimes forget formulas. The key is to stay calm, think clearly, and show how you approach problems.
That is what truly makes a great data analyst.