














Which Data Science Libraries Should Python Developers Learn First in 2026?
Learn which Data Science libraries Python developers should master first to build AI, analytics, and machine learning skills for successful careers in 2026.

Python has become the most popular programming language for data science for a good reason. Over the years, it has built a large collection of powerful libraries that make data analysis, machine learning, visualization, and automation much easier. These libraries work well together, making Python the first choice for students, professionals, and companies around the world. However, this also creates a common problem for beginners. There are so many Python libraries available that it becomes difficult to know where to start. Some blogs recommend learning deep learning libraries immediately, while others suggest focusing on data visualization or statistics first. This often leaves new learners confused and unsure about the right learning path.
This guide makes the process simple. It explains the most important data science libraries in Python, the order in which you should learn them, and why each library matters. Whether you are a beginner creating your first data science project, a software developer planning to move into data science, or a business leader selecting a data science certification program for your team, this guide will help you understand what skills are truly important. By the end of this article, you will know which Python libraries are essential, how they are used in real-world projects, how long it usually takes to learn them, the common mistakes beginners should avoid, and how these skills can support your career. You will also learn how data science consulting helps organizations solve business problems using experienced data professionals when they need faster results than building an in-house team.
Why Library Choice and Learning Order Matter
Python itself is just a general-purpose language. Its data science reputation comes entirely from its libraries — specialized packages that add numerical computing, statistical analysis, visualization, and machine learning capabilities on top of the base language.
The mistake most self-taught developers make is treating library selection as a shopping list rather than a dependency chain. In practice:
- Pandas is built on NumPy. You cannot use Pandas effectively without understanding array operations, broadcasting, and vectorization first.
- Scikit-learn expects clean, numeric, structured input — which is exactly what Pandas and NumPy produce. Skipping straight to modeling means constantly hitting data-format errors you don't know how to fix.
- Visualization libraries consume the same data structures as Pandas, so learning them in isolation (before Pandas) means relearning syntax later.
- Deep learning frameworks assume comfort with tensors, gradients, and array math — concepts NumPy teaches implicitly through repetition.
This is why nearly every credible certification in data science online curriculum — from university extension programs to industry-recognized bootcamps — follows roughly the same sequence: numerical computing → data manipulation → visualization → classical machine learning → deep learning/specialization. Deviating from this order doesn't just slow you down; it produces gaps that show up in job interviews, technical assessments, and real project work.
Why NumPy Is the Foundation of Data Science Libraries Python
What it is: NumPy (Numerical Python) provides the ndarray object — a fast, memory-efficient, multi-dimensional array — along with vectorized mathematical operations that outperform native Python loops by orders of magnitude.
Why it's first: Nearly every other data science library in Python either depends directly on NumPy or mimics its array-based mental model. Pandas DataFrames are built on NumPy arrays under the hood. Scikit-learn models expect NumPy arrays as input. TensorFlow and PyTorch tensors share conceptual DNA with NumPy arrays.
Core skills to master:
- Array creation, indexing, and slicing (including boolean and fancy indexing)
- Broadcasting rules for operations between arrays of different shapes
- Vectorized operations vs. Python loops (and why the performance gap matters at scale)
- Linear algebra operations (dot, matmul, linalg module)
- Random number generation for simulations and reproducible experiments
Real-world relevance: A retail analytics team computing rolling inventory metrics across millions of SKUs will see the difference between vectorized NumPy operations and native Python loops measured in minutes versus hours. This performance gap is often the first "aha moment" for new data scientists.
How Pandas Helps You Work Better With Data Science Libraries in Python
What it is: Pandas introduces the DataFrame — a labeled, two-dimensional data structure that behaves like a spreadsheet or SQL table but with the full power of Python behind it.
Why it's second: Real-world data is messy — missing values, inconsistent formats, mixed types. Pandas is purpose-built for the unglamorous but critical work of cleaning, transforming, and reshaping that data before any modeling happens. Industry surveys consistently show data scientists spend 60–80% of project time on data preparation, and Pandas is the primary tool for that work.
Core skills to master:
- Reading/writing CSV, Excel, JSON, SQL, and Parquet files
- Filtering, grouping (groupby), and aggregating data
- Handling missing values (fillna, dropna, interpolation)
- Merging, joining, and concatenating datasets
- Pivot tables and time-series resampling
- Method chaining for readable, efficient pipelines
Real-world relevance: A financial services firm consolidating transaction data from twelve regional databases with inconsistent date formats and currency codes relies entirely on Pandas to normalize that data before any fraud-detection model can even be trained.
Making Data Visible: Matplotlib and Seaborn
What they are: Matplotlib is Python's foundational plotting library — flexible but verbose. Seaborn is built on top of Matplotlib and provides higher-level, statistically aware chart types with far less code.
Why they're third: You cannot detect outliers, understand distributions, or communicate findings to non-technical stakeholders without visualization. This is also the layer most consulting and business-facing roles weight heavily, because a model's accuracy score means nothing to an executive — a clear chart does.
Core skills to master:
- Line, bar, scatter, and histogram plots (Matplotlib basics)
- Statistical visualizations: box plots, violin plots, pair plots, heatmaps (Seaborn)
- Customizing figures for presentations and reports
- Subplots and multi-panel dashboards
- Choosing the right chart type for the data story being told
Bonus tool — Plotly: For interactive, web-embeddable visualizations (dashboards, executive reports), Plotly has become the go-to library once Matplotlib/Seaborn fundamentals are solid.
How Scikit-learn Builds Machine Learning Skills With Data Science Libraries Python
What it is: Scikit-learn is the standard library for classical machine learning in Python — regression, classification, clustering, dimensionality reduction, and model evaluation, all behind a consistent, beginner-friendly API.
Why it's fourth: This is where the earlier foundations pay off. Scikit-learn's fit()/predict() pattern is simple, but using it well requires clean data (Pandas), numeric arrays (NumPy), and the ability to visualize results (Matplotlib/Seaborn) to validate model performance.
Core skills to master:
- Train/test splitting and cross-validation
- Regression (linear, logistic) and classification (decision trees, random forests, SVMs)
- Clustering (K-means, hierarchical clustering)
- Feature scaling, encoding, and pipeline construction
- Model evaluation metrics (precision, recall, F1, ROC-AUC, RMSE)
- Hyperparameter tuning (GridSearchCV, RandomizedSearchCV)
Why this matters more than people expect: Despite deep learning's popularity, most production business problems — churn prediction, credit scoring, demand forecasting, lead scoring — are solved more efficiently and interpretably with Scikit-learn models than with neural networks. This is a major reason data science consulting firms still lean heavily on classical ML for client deliverables: it's faster to build, easier to explain, and easier to maintain.
Specialization Layer: Deep Learning Frameworks
What they are: TensorFlow (with its high-level Keras API) and PyTorch are the two dominant frameworks for building neural networks — used for image recognition, natural language processing, generative AI, and other tasks where classical ML underperforms.
Why they come later: Deep learning requires comfort with tensor operations, gradient-based optimization, and significantly more computational overhead. Attempting this before mastering NumPy and Scikit-learn typically results in copy-pasted code that works but isn't understood — a serious liability in interviews and real projects.
|
Framework |
Best For |
Learning Curve |
Industry Adoption |
|
TensorFlow/Keras |
Production deployment, |
Moderate (Keras simplifies |
Strong in enterprise |
|
PyTorch |
Research, NLP, computer |
Moderate |
Dominant in research |
Most learners today start with PyTorch given its dominance in research and its increasingly prominent role in industry NLP/LLM work, then pick up TensorFlow/Keras if a specific job or deployment pipeline requires it.
Comparison Table: The Full Library Stack
|
Library |
Category |
Learn When |
Primary Use Case |
Alternative Tools |
|
NumPy |
Numerical |
Week 1–2 |
Array operations, |
— (foundational, no real |
|
Pandas |
Data manipulation |
Week 2–4 |
Cleaning, transforming |
Polars (faster, newer) |
|
Matplotlib |
Visualization |
Week 4–5 |
Static charts |
— |
|
Seaborn |
Statistical |
Week 4–5 |
Statistical charts |
Plotly (interactive) |
|
Scikit-learn |
Classical ML |
Week 5–8 |
Regression, |
XGBoost/LightGBM |
|
Statsmodels |
Statistical |
Week 6–8 |
Hypothesis testing, |
Scikit-learn |
|
TensorFlow/Keras |
Deep learning |
Month 3+ |
Production neural |
PyTorch |
|
PyTorch |
Deep learning |
Month 3+ |
Research, NLP, vision |
TensorFlow/Keras |
How These Data Science Libraries Work Together
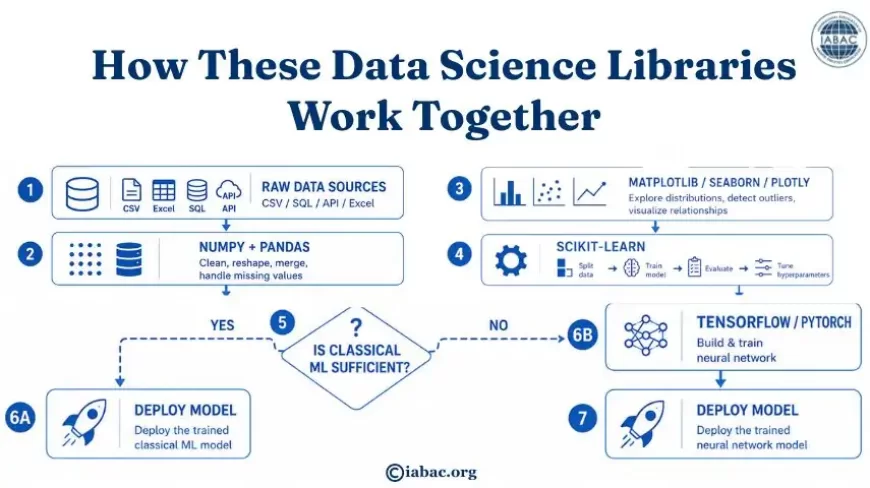
This pipeline reflects how actual data science projects flow — and it's why library learning order should mirror this pipeline rather than jumping straight to the bottom.
Benefits of Following This Learning Path
- Faster real-world project readiness. Learners who follow the NumPy → Pandas → Visualization → Scikit-learn sequence typically become project-capable within 8–12 weeks of consistent study, versus much longer when learning is scattered.
- Stronger interview performance. Technical interviews for data science and analytics roles heavily test Pandas data-wrangling scenarios and Scikit-learn model-building — not deep learning theory, in most roles.
- Better foundation for certification exams. Most respected data science certification programs structure their curricula and assessments around this same stack.
- Transferable skills across industries. Whether working in healthcare, finance, retail, or manufacturing, this library stack is domain-agnostic — only the datasets change.
- Lower cognitive overload. Learning tools in dependency order means each new library reinforces the previous one instead of requiring a mental context switch.
Challenges and Risks in the Learning Process
- Challenge: Tutorial fatigue and shallow learning. Many learners complete dozens of NumPy/Pandas tutorials without building an actual end-to-end project, leading to recognition without recall. Mitigation: Build 3–5 small end-to-end projects using real (not toy) datasets before moving to the next library.
- Challenge: Premature jump to deep learning. Drawn by AI hype, many beginners attempt TensorFlow or PyTorch before mastering NumPy fundamentals, resulting in frustration and abandoned learning. Mitigation: Set a hard rule — no deep learning frameworks until you can build a Scikit-learn model end-to-end from a messy CSV file without referencing a tutorial.
- Challenge: Version and dependency conflicts. Data science libraries update frequently, and environment management (conda, pip, virtual environments) is a common early stumbling block. Mitigation: Learn conda or venv environment management alongside the first library, not as an afterthought.
- Challenge: Overreliance on Jupyter notebooks without production skills. Notebooks are great for learning but hide poor coding habits (out-of-order execution, hidden state) that don't translate to production code. Mitigation: Periodically convert notebook work into .py scripts and functions to build production-ready habits early.
- Challenge: Certification without practical fluency. Some certification for data science programs emphasize theory over hands-on library work, leaving graduates unable to perform basic tasks employers expect. Mitigation: Choose certification programs with substantial project-based, code-graded components — not just multiple-choice theory exams.
How Data Science Libraries Python Are Used in Business Projects: Real-World Case Studies
- Case Study 1: Retail Demand Forecasting A mid-sized retail chain used Pandas to consolidate three years of point-of-sale data across 200 stores, NumPy for feature engineering (rolling averages, seasonal indices), and Scikit-learn's gradient boosting models to forecast SKU-level demand. The visualization layer (Seaborn/Plotly dashboards) was what ultimately got the model adopted — store managers trusted forecasts they could visually inspect against historical patterns, not just a black-box accuracy score.
- Case Study 2: Healthcare Readmission Risk A hospital analytics team built a 30-day readmission risk model using Pandas for cleaning inconsistent electronic health record exports, Scikit-learn's logistic regression and random forest models for interpretability (a requirement in clinical settings), and Matplotlib for generating clinician-facing risk visualizations. Deep learning was explicitly avoided here — interpretability requirements in healthcare regulatory review made classical ML the better fit, illustrating why the "learn Scikit-learn deeply before deep learning" principle matters in real deployments.
- Case Study 3: Financial Services Fraud Detection Consulting Engagement A data science consulting team engaged by a regional bank used the full pipeline: Pandas for transaction data normalization, NumPy for vectorized feature computation across millions of transactions, Scikit-learn for an initial rules-based anomaly detection layer, and PyTorch for a secondary deep learning model capturing complex fraud patterns the classical model missed. The engagement's success depended on the team's fluency across the entire stack — not any single library in isolation.
Tools and Technologies Beyond the Core Stack
Once the core five libraries are solid, several complementary tools extend capability:
|
Tool |
Purpose |
When to Learn |
|
Jupyter/JupyterLab |
Interactive development environment |
Alongside NumPy (Week 1) |
|
XGBoost / LightGBM |
Advanced gradient boosting for tabular data |
After Scikit-learn mastery |
|
Statsmodels |
Deep statistical modeling |
Parallel to Scikit-learn |
|
Polars |
High-performance alternative |
After Pandas fluency |
|
SQLAlchemy |
Database connectivity for |
Parallel to Pandas |
|
Hugging Face Transformers |
Pre-trained NLP/LLM models |
After PyTorch/TensorFlow basics |
|
MLflow |
Experiment tracking |
When moving toward production ML |
|
Docker |
Environment reproducibility |
When preparing for production roles |
Implementation Roadmap: A Realistic 90-Day Plan
Days 1–14: NumPy Foundations
Array creation, indexing, broadcasting
Small project: vectorized calculations on a numeric dataset (e.g., sales figures, sensor data)
Days 15–35: Pandas Mastery
DataFrames, cleaning, merging, grouping
Project: clean and analyze a real messy public dataset (government, Kaggle, or industry-specific)
Days 36–49: Visualization
Matplotlib and Seaborn core chart types
Project: build a visual exploratory data analysis (EDA) report on the same dataset
Days 50–70: Scikit-learn
Regression, classification, model evaluation, pipelines
Project: end-to-end predictive model with a written summary of results
Days 71–90: Choose a Specialization Path
Option A: Deepen classical ML (XGBoost, feature engineering, Statsmodels)
Option B: Begin deep learning (PyTorch or TensorFlow/Keras fundamentals)
Consider enrolling in a certification in data science online program at this stage — by now you have the practical fluency to get real value from structured coursework rather than starting from zero.
Common Mistakes to Avoid While Learning Data Science Libraries Python
- Learning libraries in isolation instead of through integrated projects. Fix: every library should be learned in the context of a project that also uses the ones before it.
- Ignoring data cleaning as "boring." Fix: reframe Pandas fluency as the highest-leverage skill in the entire stack — it's what most jobs actually require daily.
- Chasing the newest framework instead of foundational depth. Fix: resist switching to trending tools before the core stack is genuinely solid.
- No portfolio to show for months of "learning." Fix: require yourself to ship one small, complete project per library before moving on.
- Underestimating soft skills. Fix: practice explaining model results in plain language — this is what separates junior technical practitioners from those trusted with data science consulting or client-facing roles.
Future Trends Shaping This Learning Path in 2026 and Beyond
- AI-assisted coding is changing how libraries are learned, with tools that auto-generate boilerplate Pandas/Scikit-learn code — making conceptual understanding (not syntax memorization) more valuable than ever.
- Polars adoption is accelerating as datasets grow larger and Pandas' single-threaded performance becomes a bottleneck, though Pandas remains the default teaching tool due to its ecosystem maturity.
- LLM integration into classical pipelines is increasingly common — using language models for feature extraction from unstructured text before feeding results into Scikit-learn models.
- Demand for interpretable ML is rising alongside regulatory scrutiny (finance, healthcare), reinforcing Scikit-learn's continued relevance over black-box deep learning in many business contexts.
- Certification programs are shifting toward project-graded assessments rather than multiple-choice exams, reflecting employer demand for demonstrable library fluency over theoretical knowledge.
- Hybrid consulting-plus-training engagements are growing, where organizations pair data consulting services with internal upskilling so teams retain capability after the engagement ends.
Career Opportunities After Learning Data Science Libraries Python
|
Role |
Core Libraries Used |
Typical Entry Path |
|
Data Analyst |
Pandas, Matplotlib/Seaborn, basic Scikit-learn |
Certification + portfolio projects |
|
Data Scientist |
Full stack: NumPy → Scikit-learn, |
Bachelor's/Master's or bootcamp |
|
Machine Learning |
Scikit-learn, TensorFlow/PyTorch, MLOps tools |
CS background + production |
|
Data Science Consultant |
Full stack + strong communication/visualization |
Domain expertise + technical fluency |
|
Business Intelligence |
Pandas, SQL, visualization tools |
Analytics background + |
Organizations increasingly hire for this stack directly, and it's also the foundation most data consulting firms expect from analysts before assigning them to client-facing projects.
Recommended Learning Path Summary
- NumPy — array fundamentals (2 weeks)
- Pandas — data manipulation (3 weeks)
- Matplotlib + Seaborn — visualization (2 weeks)
- Scikit-learn — classical machine learning (3–4 weeks)
- Statsmodels or XGBoost — optional depth in classical methods (2 weeks)
- PyTorch or TensorFlow — deep learning specialization (4+ weeks, only after steps 1–4 are solid)
- Certification in data science online — to validate and formalize skills once practical fluency exists
Your Next Steps After Learning Data Science Libraries Python
The path to genuine data science fluency in Python isn't about collecting library names — it's about learning them in the order that mirrors how real projects actually work: clean numerical foundations, structured data manipulation, clear visualization, and then classical machine learning before venturing into deep learning specialization. This sequence isn't a suggestion; it's what separates practitioners who can build and explain a working project from those who can only recite library documentation. It's also what employers test for, what data science certification programs are increasingly built around, and what data science consulting firms rely on when staffing client engagements.
Actionable next steps:
- Audit your current skills against the NumPy → Pandas → Visualization → Scikit-learn → Deep Learning sequence and identify your actual starting point.
- Commit to the 90-day roadmap above, building one real project per library milestone.
- Evaluate certification in data science online programs based on how much hands-on, code-graded project work they require — not just credential prestige.
- If your organization needs faster results than an internal learning curve allows, evaluate data consulting partners who can deliver immediate technical outcomes while your team builds capability in parallel.
The libraries themselves will keep evolving — but the learning order, and the discipline of building real projects at each stage, is the most durable skill of all.