Business Analytics Software Tools and Features
Learn about business analytics software tools and their key features, including reporting, dashboards, predictive analytics, and data-driven decision support.

There was a time when reports meant long Excel sheets, endless scrolling, and someone saying, “Please check column AQ.” Today, business moves too fast for that. Decisions cannot wait for manual reports. Leaders want answers now. Teams want clarity now. And organizations want performance now. This is where business analytics software changes everything.
Business analytics is no longer a luxury used by large companies with big budgets. It is now a daily working tool for teams, managers, analysts, and decision-makers across industries. From sales and marketing to finance and operations, every department depends on data. But data alone is useless. The real power comes from software that turns raw numbers into clear, visual, and actionable insights.
This is why understanding business analytics software tools and features is very important for anyone planning a career in analytics, reporting, or decision-making roles. Whether you want to work as an analyst, consultant, or manager, knowing how these tools work gives you a strong advantage. This is also why many learners today choose business analytics certifications and programs like the Certified Business Analytics Expert to build practical skills with these tools.
Let’s explore the tools, features, and real value of business analytics software in a way that makes complete sense.
What Is Business Analytics Software?
Business analytics software is a set of digital tools that help organizations:
- Collect data from different sources
- Clean and prepare the data
- Analyze patterns and trends
- Create dashboards and reports
- Predict future outcomes
- Support decision-making with facts
Instead of spending hours creating reports manually, professionals use software that automatically updates dashboards, shows performance metrics, and highlights problems before they become serious.
This software answers questions like:
- Why are sales dropping in one region?
- Which marketing campaign is giving better results?
- Where is the company losing money?
- What will happen next month if this trend continues?
Why Companies Depend on Business Analytics Software
Organizations generate huge amounts of data every day. For example:
- E-commerce companies track thousands of orders daily
- Banks track millions of transactions
- Marketing teams track clicks, views, conversions, and campaigns
- HR teams track performance, hiring, and retention metrics
Without proper tools, this data becomes confusing and unused. With business analytics software, companies get:
- Faster reporting
- Better decisions
- Improved performance
- Clear performance tracking
- Time savings for teams
This is why many professionals search for business analytics software for better reporting and business analytics software that improves performance as part of their learning journey.
Popular Business Analytics Software Tools
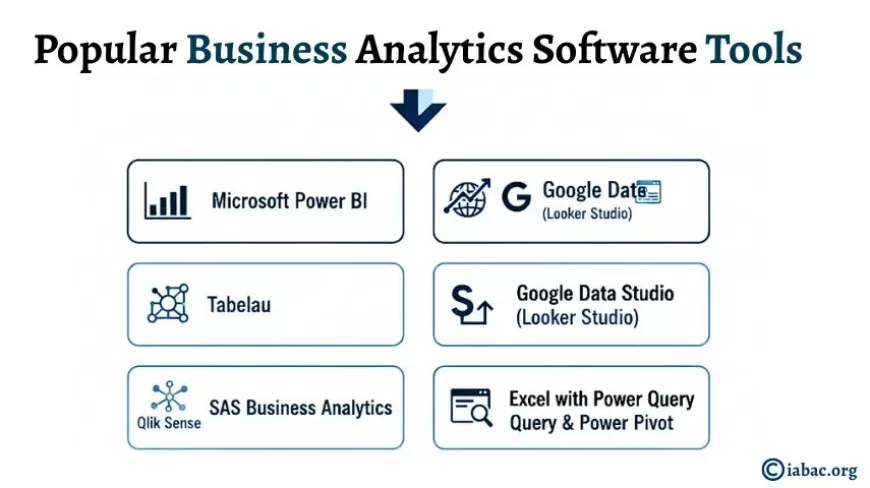
Here are some widely used tools across industries:
1. Microsoft Power BI
One of the most popular tools for dashboards and reports. Easy to connect with Excel, databases, and cloud platforms.
2. Tableau
Known for powerful data visualization and interactive dashboards.
3. Google Data Studio (Looker Studio)
Free and useful for marketing and web analytics reporting.
4. Qlik Sense
Great for associative data modeling and fast analysis.
5. SAS Business Analytics
Used for advanced analytics and statistical modeling.
6. Excel with Power Query & Power Pivot
Still widely used, especially for data preparation and basic reporting.
These tools are often included in business analytics certifications because they are used daily in real workplaces.
Core Features of Business Analytics Software
Understanding features is more important than only knowing tool names.
Data Integration
The software can connect to multiple sources:
- Excel files
- CRM systems
- Databases
- Cloud storage
- Marketing platforms
This saves time and avoids manual copying of data.
Data Cleaning and Preparation
Raw data usually has errors, duplicates, and missing values. These tools clean and transform data automatically.
Dashboards and Visual Reports
Instead of long tables, users see:
- Charts
- Graphs
- KPI indicators
- Performance summaries
This makes reports easy to understand even for non-technical people.
Real-Time Reporting
Dashboards update automatically when new data comes in.
Drill-Down Analysis
Users can click on a chart to see deeper details.
Predictive Analytics
Some tools can forecast future trends based on past data.
Collaboration
Teams can share dashboards and work together.
Business Analytics Software for Professionals
Professionals in different roles use this software differently:
- Sales managers track targets and region performance
- Marketing teams track campaign ROI and conversion rates
- Finance teams track revenue, costs, and profit margins
- HR teams track hiring and employee performance
- Operations teams track efficiency and delays
This is why there is high demand for people trained in business analytics software for professionals.
Metrics That Business Analytics Software Tracks
Here are some important metrics often used in dashboards:
- Sales growth percentage
- Customer acquisition cost (CAC)
- Customer lifetime value (CLV)
- Conversion rate
- Return on investment (ROI)
- Employee productivity rate
- Inventory turnover ratio
- Profit margin
- Website bounce rate
- Lead generation rate
These metrics help organizations measure performance clearly.
How These Tools Improve Reporting
Earlier:
- Reports took hours or days
- Manual errors were common
- Data was outdated
Now:
- Reports update automatically
- Visual dashboards show performance instantly
- Decision-makers get answers in minutes
This is why companies invest in business analytics software for better reporting.
Real Workplace Example
Imagine a company running online ads.
Without analytics software:
- The marketing team downloads data from ads platform
- Creates Excel sheets
- Prepares charts manually
- Sends report after two days
With analytics software:
- The dashboard is already connected to ads platform
- Shows live clicks, conversions, cost, and ROI
- Manager checks performance in seconds
Time saved = better decisions = improved performance.
Skills Required to Use Business Analytics Software
To work with these tools, professionals learn:
- Basic business analytics concepts
- Data cleaning techniques
- Dashboard design
- Understanding KPIs
- Interpreting charts
- Business problem understanding
These skills are taught in structured programs like Business Analytics Certifications and the Certified Business Analytics Expert program.
How Business Analytics Software Improves Performance
When companies use these tools properly, they see:
- 30–40% faster reporting time
- 20–25% improvement in decision speed
- Reduced manual errors
- Better tracking of team performance
- Higher return on marketing and sales efforts
This is why many organizations actively hire people trained in business analytics software.
Features That Make a Good Business Analytics Tool
When choosing software, companies look for:
- Easy data connection
- User-friendly interface
- Strong visualization options
- Real-time updates
- Cloud access
- Security features
- Scalability for large data
Career Benefits of Learning Business Analytics Software
Professionals skilled in these tools can work as:
- Business Analyst
- Data Analyst
- Reporting Analyst
- Analytics Consultant
- BI Developer
These roles are growing fast across industries.
Why Certifications Matter
Learning tools on your own is helpful. But structured learning with real projects makes a difference.
Programs like:
- Business Analytics Certifications
- Certified Business Analytics Expert
help learners gain practical exposure to tools used in real companies.
These certifications focus on:
- Hands-on projects
- Real dashboards
- Case studies
- Industry use cases
Future of Business Analytics Software
Companies are moving towards:
- AI-based dashboards
- Automated insights
- Voice-enabled reports
- Predictive and prescriptive analytics
This makes learning these tools even more important.
Data is everywhere. But without the right tools, it is just numbers on a screen. Business analytics software turns those numbers into clear stories, helpful reports, and smart decisions. From better reporting to improved performance, these tools are now part of daily business operations. Professionals who understand how to use them are always in demand. This is why many learners choose business analytics certifications and programs like the Certified Business Analytics Expert to build strong skills.
Understanding Business Analytics Software tools and features are not only helpful for career growth but also necessary to stay relevant in modern workplaces. The good news is that once you learn these tools, you start seeing data differently. Reports become simple. Insights become clear. And decisions become smarter.
That is the real power of business analytics software.