


Top Business Analytics Tools for 2026
Explore the top business analytics tools of 2026, offering advanced data insights, predictive analytics, and real-time decision-making capabilities.

Having the right tools to analyze data is no longer optional—it’s essential. As we move into 2026, businesses are dealing with larger volumes of data than ever before. From sales figures and customer feedback to social media interactions and operational metrics, data is everywhere.
In this blog, I want to share some of the best business analytics tools for 2026, explain what they do, and show how they can help businesses like yours make smarter decisions and achieve sustainable growth.
The Importance of Business Analytics
Modern businesses generate massive amounts of data every single day. However, data alone has little value unless it is analyzed and interpreted correctly. Business analytics tools help organizations turn raw data into meaningful insights, enabling leaders to understand performance, identify opportunities, and respond quickly to market changes.
Why Business Analytics Matter
- Informed Decision-Making: Analytics tools allow businesses to make decisions based on facts and data rather than assumptions or guesswork.
- Identifying Trends: By analyzing customer behavior, sales patterns, and market movements, companies can spot trends early and adjust strategies proactively.
- Improving Efficiency: Analytics helps uncover inefficiencies in workflows and processes, allowing businesses to optimize operations and reduce costs.
Choosing the Right Analytics Tools
With so many analytics tools available, selecting the right ones can be challenging. Organizations often struggle with tool integration, employee adoption, and scalability as their data needs grow. The best analytics tools are those that are easy to use, flexible, and aligned with business goals.
So, which business analytics tools are the most effective and user-friendly in 2026?
Below are some of the top tools that continue to empower businesses with powerful analytics capabilities.
Top Business Analytics Tools for 2026
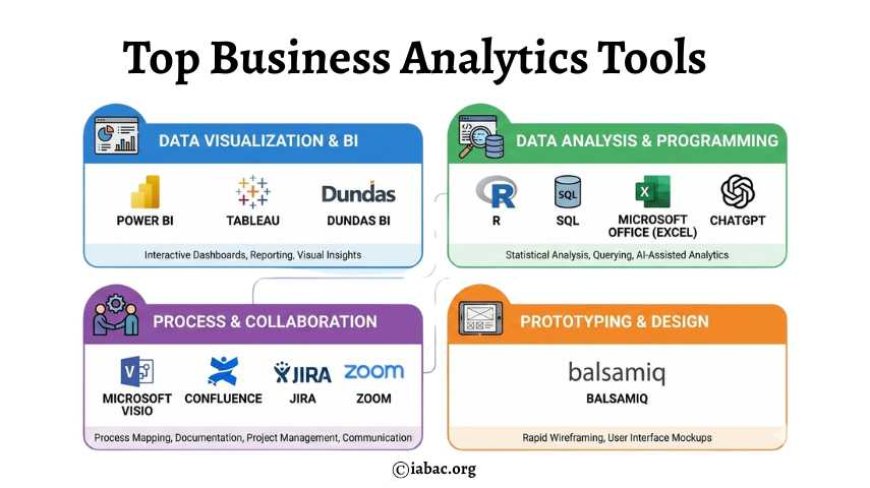
1. Microsoft Visio
Microsoft Visio is ideal for creating visual representations of complex business processes.
- Use Case: Designing flowcharts and process diagrams
- Integration: Works seamlessly with Microsoft Office tools
- Example: A marketing team can map the customer journey to visualize every touchpoint from awareness to purchase.
2. Power BI
Power BI is a powerful yet user-friendly business intelligence and data visualization tool.
- Interactive Dashboards: Real-time data updates
- Data Connectivity: Connects with Excel, SQL, and cloud platforms
- Example: A retail company can analyze regional sales performance and adjust inventory based on demand trends.
3. Tableau
Tableau is known for its advanced and interactive data visualization capabilities.
- Dynamic Visuals: Highly customizable charts and graphs
- Data Blending: Combines multiple data sources into one view
- Example: Financial analysts use Tableau to present performance insights and highlight key trends to stakeholders.
4. R
R is a powerful open-source programming language widely used for statistical analysis.
- Advanced Analytics: Supports complex statistical modeling
- Extensive Libraries: Ideal for predictive analytics and data mining
- Example: Healthcare organizations use R to analyze patient data and predict treatment outcomes.
5. Dundas BI
Dundas BI focuses on automated analytics and performance monitoring.
- Custom Dashboards: Tailored to specific business needs
- Real-Time Insights: Monitor KPIs continuously
- Example: Logistics companies use Dundas BI to optimize delivery routes using historical performance data.
6. Microsoft Office (Excel)
Despite the rise of advanced tools, Excel remains a cornerstone of data analysis.
- Data Analysis: Formulas, pivot tables, and data modeling
- Visualization: Charts and graphs for clear reporting
- Example: Project managers track budgets, timelines, and resource allocation using Excel dashboards.
7. Balsamiq
Balsamiq is a wireframing tool used for quick visual planning.
- Rapid Prototyping: Sketch ideas quickly
- Simple Interface: Drag-and-drop design
- Example: Product teams use Balsamiq to design and refine application layouts before development begins
8. SQL
SQL remains essential for managing and querying large databases.
- Data Extraction: Retrieve specific datasets efficiently
- Data Management: Insert, update, and delete records
- Example: Analysts use SQL to pull sales data for performance analysis and reporting.
9. Zoom
Zoom plays a key role in collaboration and data discussions.
- Screen Sharing: Review dashboards and reports together
- Meeting Recording: Preserve insights and decisions
- Example: Analytics teams conduct virtual reviews of performance metrics and insights
10. ChatGPT
ChatGPT is an AI-powered tool for analyzing and interpreting text-based data.
- Insight Generation: Analyze customer reviews and feedback
- Natural Language Processing: Understand patterns in unstructured data
- Example: Marketing teams use ChatGPT to identify recurring customer concerns and sentiment trends.
11. Confluence
Confluence supports documentation and knowledge sharing across teams.
- Centralized Documentation: Store analytics insights and reports
- Collaboration: Easy access for cross-functional teams
- Example: Analytics teams document findings so insights can be reused across departments.
12. Jira
Jira is a popular project management tool for analytics and data teams.
- Task Management: Track analytics projects and workflows
- Team Collaboration: Clear ownership and deadlines
- Example: Data teams manage analytics initiatives and ensure timely delivery of insights.
Business Analytics Tools: Key Areas Businesses Often Miss
Business data is growing every day. Sales records, customer details, website activity, and reports all create valuable information. But using data well is not just about charts and dashboards. To get real value, businesses must focus on a few important areas that are often ignored.
In this blog, we will look at the key topics related to Business Analytics Tools that many businesses miss, but should not.
Data Quality and Data Management
Business Analytics Tools work best only when the data is correct. If the data has errors, missing values, or duplicates, the results will not be reliable.
Data quality means keeping information clean, accurate, and updated. Data management helps organize who owns the data, who can use it, and how it should be handled. When businesses follow clear rules for data, reports become more reliable, and teams trust the numbers they see.
Good data quality helps avoid mistakes, saves time, and supports better business choices.
Data Security and Privacy
Data often includes sensitive details such as customer names, payment information, and business plans. When using Business Analytics Tools, keeping this data safe is very important.
Companies must protect data by controlling access, using secure systems, and following privacy rules. Only the right people should be able to view or change important data. This reduces the risk of data loss and builds trust with customers and partners.
Strong security practices help businesses stay safe and compliant with rules and policies.
Cloud-Based Analytics Tools
Many businesses now use cloud-based Business Analytics Tools instead of storing everything on local systems. Cloud tools allow teams to access data from anywhere and work together easily.
These tools grow with the business, reduce system costs, and do not need heavy setup. Updates are handled automatically, which saves time for teams.
Cloud analytics is helpful for businesses that want flexibility and faster access to insights.
Data Integration and ETL Tools
Most businesses use more than one system. Sales data may come from one tool, customer data from another, and finance data from a different source. Business Analytics Tools need all this data in one place.
Data integration tools help bring information together in a clear and usable format. ETL tools collect data, clean it, and load it into analytics systems. This makes reports more accurate and saves manual effort.
When data flows smoothly between systems, businesses get a complete view of their performance.
AI and Predictive Analytics Tools
Modern Business Analytics Tools go beyond past reports. They help businesses understand what may happen next.
Predictive analytics uses past data to identify patterns and give future estimates. This helps businesses plan sales, manage stock, and understand customer behavior. AI-based tools can also reduce manual work by finding patterns automatically.
These tools support smarter planning and help teams act early instead of reacting late.
Real-Time Analytics
Some businesses need instant updates. Waiting for daily or weekly reports is not always enough. Real-time analytics tools process data as it comes in.
These tools help track live activity such as website visits, transactions, or delivery updates. Teams can spot issues quickly and take action right away.
Real-time analytics is useful for fast-moving industries where quick decisions matter.
Self-Service Analytics for Business Users
Not everyone using data is a technical expert. Self-service Business Analytics Tools allow non-technical users to create reports, charts, and summaries on their own.
These tools are easy to use and reduce dependence on technical teams. Managers and business users can explore data without waiting for support.
Self-service analytics encourages teams to use data more often and improves decision speed.
Data Storytelling and Clear Reporting
Numbers alone are not enough. Insights must be explained clearly so everyone understands them. Data storytelling focuses on presenting results in a simple and meaningful way.
Using clear visuals, short explanations, and real examples helps decision-makers understand the message quickly. Good reporting turns data into action instead of confusion.
Clear communication makes Business Analytics Tools more effective.
Measuring the Value of Analytics
Using Business Analytics Tools is an investment. Businesses should track how analytics helps improve results.
Measuring value means checking how analytics supports growth, saves time, reduces costs, or improves customer experience. Clear goals and regular reviews help teams understand what works and what needs improvement.
This ensures analytics efforts stay useful and aligned with business needs.
As businesses continue to rely on data-driven strategies in 2026, choosing the right combination of analytics tools can make a significant difference. Each tool discussed here serves a unique purpose—from data visualization and advanced analysis to collaboration and project management. I encourage you to evaluate your organization’s needs and identify the tools that best support your analytics strategy. The right tools empower teams to make smarter decisions, improve efficiency, and stay competitive in an increasingly data-driven world.