


Module 3: Analytics Classification
Learn how descriptive, diagnostic, predictive and prescriptive analytics power data science and help businesses make smarter, data-driven decisions

Making Sense of Data Through Analytics
After seeing data science in action in Module 2, it’s time to uncover the real engine behind every data project — analytics.
Analytics transforms raw numbers into stories. It explains patterns, uncovers causes, predicts outcomes, and even recommends the next best move.
In this module, you’ll learn about the four types of analytics that power decision-making in modern organizations — Descriptive, Diagnostic, Predictive, and Prescriptive analytics.
By understanding analytics classification, you’ll see how businesses evolve from knowing what happened to deciding what to do next.
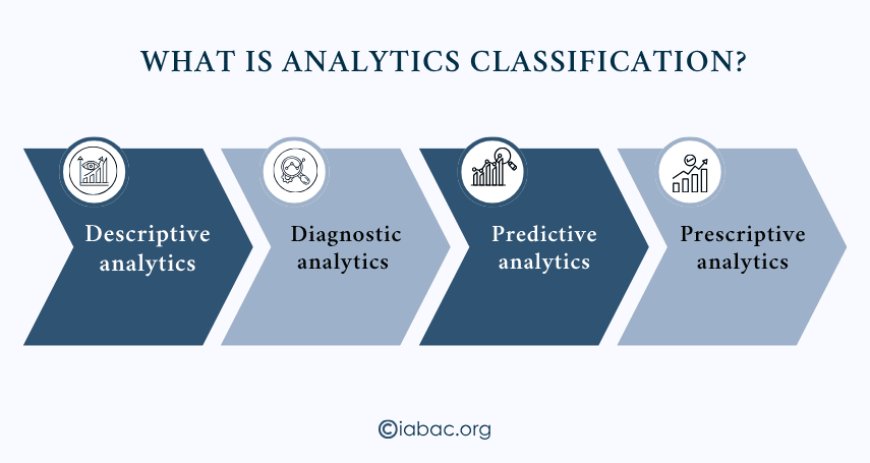
1. What Is Analytics Classification?
Analytics classification means going through the process of analyzing data into categories based on purpose. Each type serves a unique role in helping businesses and data scientists interpret information effectively.
Here’s the simple flow:
-
Descriptive analytics explains what happened.
-
Diagnostic analytics explores why it happened.
-
Predictive analytics forecasts what might happen next.
-
Prescriptive analytics suggests what actions to take.
Together, they form a complete data-driven cycle — moving from awareness to action.
2. Descriptive Analytics — Looking Back to Understand the Past
Descriptive analytics focuses on summarizing past data. It answers one simple question: What happened?
This is usually the first stage of analytics in any organization. Data is collected, organized, and presented in an understandable format — often through reports, dashboards, or charts.
Examples include:
-
Monthly sales reports showing growth or decline.
-
Website traffic summaries on Google Analytics.
-
Customer satisfaction scores displayed in visual dashboards.
Descriptive analytics helps organizations build awareness. It doesn’t explain why changes occur — but it gives a clear picture of what’s been happening.
Tools used: Excel, Power BI, Tableau, Google Data Studio.
3. Diagnostic Analytics — Finding the Cause Behind the Data
Once businesses know what happened, the next question naturally follows: Why did it happen?
That’s where diagnostic analytics comes in.
It looks deeper into the data to find the reasons behind trends or problems.
For instance:
-
If sales dropped in June, diagnostic analytics checks which regions, products, or customer segments caused the decline.
-
It uses techniques like correlation analysis and data comparison to uncover causes.
Common methods:
-
Root cause analysis
-
Correlation testing
-
Drill-down data exploration
Diagnostic analytics turns numbers into insights. It gives context — helping teams make sense of patterns instead of just observing them.
4. Predictive Analytics — Looking Ahead
Once the causes are understood, organizations start asking: What is likely to happen next?
Predictive analytics uses historical data, statistical methods, and machine learning to make forecasts about future outcomes.
In a retail example, predictive analytics might:
-
Estimate next month’s sales.
-
Identify customers likely to stop buying.
-
Forecast which products will trend during the holidays.
Predictive models learn from past behavior to anticipate future events.
They don’t guarantee accuracy — but they provide a data-backed direction.
Common tools and techniques:
-
Regression analysis
-
Classification models
-
Decision trees
-
Time-series forecasting
Predictive analytics gives businesses an edge — helping them act before opportunities or risks arise.
5. Prescriptive Analytics — Turning Insight into Action
The final stage is prescriptive analytics, which answers the question: What should we do next?
This type of analytics uses predictions and simulations to recommend the best course of action.
It blends analytics with optimization — guiding companies toward smarter decisions.
Example in the retail context:
-
If predictive analytics shows that customer churn might increase, prescriptive analytics can suggest targeted retention offers or loyalty programs.
Tools and methods:
-
Optimization algorithms
-
Simulation models
-
Scenario testing
Prescriptive analytics doesn’t just describe or predict — it advises. It helps decision-makers turn data into direct action plans that improve results.
6. Analytics in Action — A Simple Retail Example
To see how all four types of analytics work together, let’s revisit our retail company example from Module 2.
The company wants to understand customer behavior and improve loyalty. Here’s how analytics supports each stage:
|
Analytics Type |
Key Question |
Example |
|
Descriptive |
What happened? |
Monthly report shows a 15% drop in repeat customers. |
|
Diagnostic |
Why did it happen? |
Most churned customers had low engagement and poor service ratings. |
|
Predictive |
What will happen next? |
The model forecasts a 10% additional churn next quarter. |
|
Prescriptive |
What should we do? |
Offer personalized discounts and improve response time. |
This step-by-step process helps the company move from simply reacting to problems to anticipating and preventing them — that’s the true power of analytics classification.
7. Common Tools for Analytics Classification
Analytics doesn’t always require deep coding. Many tools make analysis accessible even for beginners:
-
Tableau – for data visualization and storytelling.
-
Power BI – for business intelligence dashboards.
-
Excel – for basic descriptive and diagnostic analytics.
-
Python / R – for predictive and prescriptive modeling.
-
SQL – for managing and querying structured data.
The choice of tool depends on the problem, data size, and the level of analysis required.
8. Why Analytics Classification Matters
In a data-driven world, decisions backed by analytics carry more confidence. Understanding these four types builds a foundation for stronger problem-solving and strategic planning.
Here’s why it matters:
-
It improves data literacy — you learn to read data like a story.
-
It strengthens collaboration between business and technical teams.
-
It prepares you for advanced topics like AI and machine learning.
-
It’s a sought-after skill for data analysts, marketers, and managers.
Many professionals miss growth opportunities because they don’t understand how analytics connects to business outcomes. Learning analytics classification now helps you stay ahead — making you more adaptable in any data-focused role.
Next Steps
In this module, you learned how analytics turns raw data into direction:
-
Descriptive analytics shows what happened.
-
Diagnostic analytics reveals why it happened.
-
Predictive analytics anticipates what might happen.
-
Prescriptive analytics guides what to do next.
Each stage builds on the one before it — together they form a full cycle of understanding, forecasting, and acting.
With this foundation, you’re ready to explore how analytics connects to broader technologies in the next module.
Next in the series: [Module 4 – Data Science and Related Fields]
You’ll discover how fields like Artificial Intelligence, Natural Language Processing, and Computer Vision relate to data science and how they shape modern innovation.


