


Types of Data Analytics and Their Use
Ever wondered how companies know what customers want? Explore the types of data analytics with real examples, simple explanations, and 2026 insights.

Have you ever wondered how your favorite shopping app seems to know exactly what you need? Or how businesses decide the perfect time to launch a sale? It’s not luck — it’s data doing the talking.
Every click, purchase, and search creates information. Companies use this information to understand patterns and make better decisions. Instead of relying only on experience, organizations now look at insights hidden in numbers.
This is where data analytics comes in. But data analytics isn’t just one approach. It includes different types, and each one answers a different question. Understanding these types makes it easier to see how businesses turn raw data into meaningful actions.
What Is Data Analytics?
At its core, data analytics is the process of examining raw information to find answers. You collect data, clean it up, study it, and draw conclusions that help you make smarter decisions.
But here's what most introductions miss — analytics isn't one thing. There are different types, and each one answers a different question. Think of them as layers. Each layer goes a little deeper than the last.
You’ll find data analytics being used in:
- Healthcare: spotting health risks early
- Marketing: understanding what people like
- Finance: Stopping Fraud Before It Happens
- Logistics: delivering your pizza hot and fast
Even small businesses are now using data to decide what to sell, when to offer discounts, or how to treat their loyal customers.
Why Does Data Analytics Matter?
Here’s why data analytics is such a big deal (besides making people sound smart at meetings):
- It helps companies make decisions based on facts, not just gut feelings
- Saves money by improving processes
- Shows trends in customer behavior
- Improves the quality of products or services
- Catches problems like fraud before they get out of hand
The 5 Types of Data Analytics
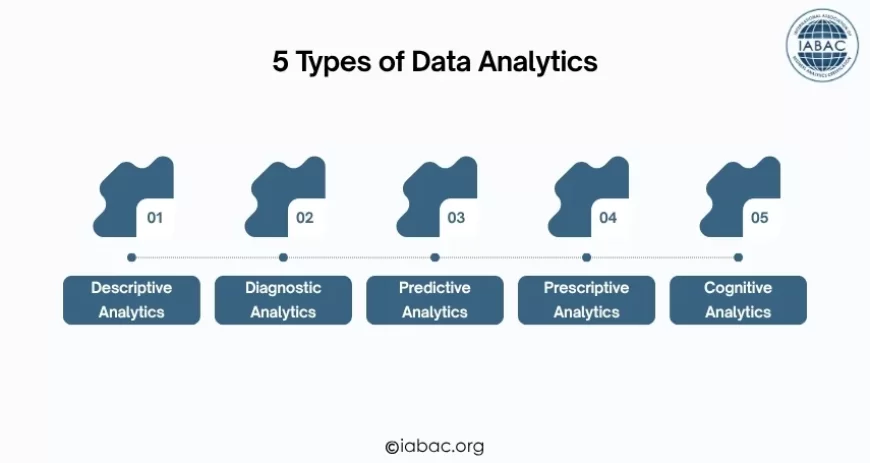
1. Descriptive Analytics: "What happened?"
This is where everyone starts. Descriptive analytics looks at historical data and summarizes it. Monthly sales reports, website traffic numbers, customer counts — all of this falls under descriptive analytics.
It doesn't explain anything or predict anything. It just tells you what the numbers say.
Real examples:
-
How many orders did we process last quarter?
-
Which product category generated the most revenue?
-
How many users visited our pricing page this week?
Common tools: Excel, Google Looker Studio, Power BI, Tableau
Where it's used most: Finance reporting, retail performance tracking, marketing dashboards, operations reviews
Descriptive analytics is the foundation. You cannot diagnose a problem or predict a trend without first knowing what actually happened.
2. Diagnostic Analytics: "Why did it happen?"
Once you know what happened, the natural next question is: why? That's what diagnostic analytics is for. It digs into your data to find the cause behind a result.
This involves comparing data sets, looking for patterns, and tracing problems back to their source.
Real examples:
-
Sales dropped 18% in March — was it pricing, a competitor launch, or reduced ad spend?
-
Customer complaints spiked after a product update — which feature change triggered it?
-
Delivery times increased in one region — is it a logistics issue or a demand surge?
Methods used: Correlation analysis, root cause analysis, drill-down reporting, and data mining.
Where it's used most: E-commerce troubleshooting, manufacturing quality control, customer retention analysis, and healthcare incident reviews.
Diagnostic analytics saves businesses from making decisions based on assumptions. Instead of guessing why something went wrong, you find out.
3. Predictive Analytics: "What might happen next?"
This is where the work gets more technical. Predictive analytics uses patterns in your historical data to estimate what's likely to happen in the future.
It's not guessing. It's math — specifically, statistical models and machine learning algorithms trained on past behavior.
Real examples:
-
Which customers are likely to cancel their subscription in the next 30 days?.
-
How much inventory will we need for the festive season?.
-
What's the probability that this loan applicant will default?.
Tools used: Python, R, Scikit-learn, SAS, Azure Machine Learning
Where it's used most: Banking (credit scoring), healthcare (patient risk), retail (demand forecasting), insurance (claims prediction), HR (attrition modeling)
In 2026, predictive analytics has moved from being a specialist capability to something embedded in everyday business software — from CRMs to supply chain platforms.
4. Prescriptive Analytics: "What should we do about it?"
Prescriptive analytics takes the output of predictive analytics and turns it into recommended actions. It doesn't just tell you what's likely to happen — it tells you what to do about it.
This is the most advanced of the four core types and requires both data and a clear understanding of what outcomes you're trying to achieve.
Real examples:
-
Given predicted demand, which warehouses should we stock and by how much?
-
Based on this customer's behavior, what offer should we show them?
-
Which maintenance schedule will extend machine life while minimizing downtime?
Methods used: Optimization models, simulation, decision trees, linear programming
Where it's used most: Logistics (route optimization), energy (grid management), hospitals (resource allocation), airlines (dynamic pricing), retail (promotions strategy)
If descriptive analytics is the rearview mirror and predictive analytics is the windshield, prescriptive analytics is the GPS — it tells you which turn to take.
5. Cognitive Analytics: "What does this actually mean?"
This is one of the newer approaches gaining popularity, and it's the one most shaped by advances in artificial intelligence.
Cognitive analytics processes data the way a human mind would — it reads context, understands language, interprets images, and draws conclusions from messy, unstructured information. Think customer reviews, support chat logs, social media posts, audio recordings, and documents.
Traditional analytics tools struggle with this kind of data because it doesn't fit neatly into rows and columns. Cognitive analytics handles it.
Real examples:
-
Reading thousands of customer reviews and identifying the 3 most common complaints
-
Analyzing support transcripts to detect frustration before a customer churns
-
Scanning medical notes to flag potential misdiagnoses
-
Processing multilingual feedback from global users without manual translation
Technologies involved: Natural language processing (NLP), machine learning, deep learning, computer vision
Where it's used most: Customer experience management, healthcare records analysis, financial compliance, HR talent screening, media monitoring
Cognitive analytics is what allows companies to finally make use of the 80% of their data that sits in documents, conversations, and content — not just structured databases.
Two More Types Worth Knowing
Beyond the five main types, two additional approaches have become important enough in 2026 to deserve their own mention.
Augmented Analytics
Augmented analytics uses AI to handle the parts of analysis that used to require a specialist — cleaning data, spotting patterns, and generating summaries. The goal is to put meaningful insights in the hands of people who aren't data scientists.
A marketing manager can now ask a question in plain English and get a visual answer. A store manager can see which product lines are trending without opening a spreadsheet. This is augmented analytics doing the heavy lifting in the background.
It doesn't replace analysts — it makes their work faster and makes data accessible to more people across an organization.
Real-Time Analytics
In 2026, waiting for a weekly report to make a decision is too slow for many industries. Real-time analytics processes data the moment it's generated, enabling instant action.
A bank flags a suspicious transaction in milliseconds. An e-commerce site adjusts a product recommendation as a user browses. A factory sensor detects a machine irregularity before it becomes a failure.
Real-time analytics has become standard in finance, logistics, cybersecurity, and any business where delays cost money or safety.
Quick Comparison Table
|
Type |
Core Question |
Key Method |
Best Used For |
|
Descriptive |
What happened? |
Summarization, reporting |
Performance reviews, trend monitoring |
|
Diagnostic |
Why did it happen? |
Root cause analysis, correlation |
Troubleshooting, churn analysis |
|
Predictive |
What might happen? |
Machine learning, statistical models |
Forecasting, risk assessment |
|
Prescriptive |
What should we do? |
Optimization, simulation |
Strategy, pricing, logistics |
|
Cognitive |
What does this mean? |
NLP, deep learning |
Unstructured data, sentiment, documents |
|
Augmented |
How do we make this easier? |
AI-assisted automation |
Self-service analytics, insight generation |
|
Real-Time |
What's happening right now? |
Streaming data pipelines |
Fraud detection, live personalization |
The Analytics Process: From Raw Data to Real Decisions
Understanding the types is one thing. Knowing how the process actually works helps you see how they connect.
Step 1: Collect: Data comes in from websites, apps, sensors, sales systems, social media, and support tools. The challenge isn't getting data — it's getting the right data.
Step 2: Clean: This is the unglamorous part. Removing duplicates, fixing errors, filling gaps, standardizing formats. Analysts often spend more time here than anywhere else. Bad data in means bad insights out.
Step 3: Transform: The cleaned data gets shaped into a format ready for analysis — aggregated, merged with other sources, or restructured to answer specific questions.
Step 4: Analyze: This is where the chosen type of analytics (descriptive, diagnostic, predictive, etc.) gets applied. The right type depends entirely on the question you're trying to answer.
Step 5: Visualize and Interpret: Numbers become charts, dashboards, and stories. The goal here is to communicate the insight clearly — to someone who may not have looked at the raw data at all.
Step 6: Act: Insight without action is just a report. The final step is making a decision or changing a process based on what the data showed.
Where Data Analytics Is Being Used in 2026
The importance of analytics continues to grow. According to industry reports, over 70% of executives say leveraging data analytics and AI is a top priority for innovation in 2026, showing how organizations increasingly depend on data-driven decision-making.
Business and Retail
Understanding why customers leave, which promotions actually work, how to price products competitively in real time, and which inventory to stock at which locations.
Healthcare
Predicting patient readmissions, allocating staff across hospital wards, detecting early signs of disease through diagnostic imaging analysis, and monitoring population health trends.
Finance and Banking
Detecting fraudulent transactions the moment they occur, scoring creditworthiness, optimizing investment portfolios, and meeting regulatory reporting requirements.
Manufacturing
Predicting equipment failures before they happen (predictive maintenance), optimizing production schedules, and reducing waste through quality control analytics.
Logistics and Supply Chain
Route optimization, demand forecasting, real-time shipment tracking, warehouse efficiency modeling.
Why Get a Data Analytics Certification?
Let’s be honest: learning data analytics can feel like learning a new language. That’s where a data analytics certification comes in.
It helps you:
- Learn step by step, without getting overwhelmed
- Get noticed by employers (hello, better job!)
- Prove your skills with real projects
- Choose what you want to focus on — like machine learning, business analytics, or predictive models
Tip: Check out certification programs from IABAC, which are trusted and globally recognized.
Skills That Matter Right Now
Technical:
-
SQL: Still the most used language in data work, by a wide margin.
-
Python: For analysis, modeling, and automation.
-
Power BI or Tableau: For turning data into something people can actually read.
-
Basic understanding of machine learning concepts — you don't need to build models, but you need to understand what they can and can't do.
-
Data cleaning and preparation — arguably the most underrated skill in the field.
Non-Technical:
-
Business context: Knowing what question is actually worth answering.
-
Clear communication: Explaining what the data says to someone who didn't look at it.
-
Critical thinking: Knowing when to trust the output and when to question it.
-
Curiosity: The best analysts ask better follow-up questions than the ones they started with.
Trends in Data Analytics for 2026
Here’s what’s making data analytics cooler than ever:
- Automated Insights – AI tools are doing the heavy lifting by analyzing data faster
- Edge Analytics – Devices like smartwatches and machines are analyzing data right where it’s collected
- NLP (Natural Language Processing) – Now you can “talk” to your data dashboards like you talk to your smart speaker
- Augmented Analytics – Tools are learning how to clean and organize data for you (finally!)
- Self-Service Tools – Anyone in a company, not just data geeks, can use these tools easily
Data analytics isn’t about having more data — it’s about using data in the right way. Organizations that understand which type of analytics to use can make faster and smarter decisions.
Once you understand these types, you’re already one step closer to working confidently with data. From simple reports to advanced predictions, everything starts with choosing the right approach.
If you want to build practical skills and apply these concepts in real business scenarios, structured learning paths like the IABAC data analytics certification can help you move from understanding theory to solving real-world problems.