What is Self-Service Business Intelligence?
Self-service business intelligence lets teams analyze data without IT support, using BI tools that turn raw numbers into clear, actionable insights faster.

Every department generates data sales logs transactions, marketing tracks campaigns, and support logs tickets. Most of that data still routes through a centralized BI team, which means anyone outside that team waits days or weeks for an answer to a question that could be resolved in minutes. This is the exact gap self-service business intelligence is designed to close.
Instead of filing a request and waiting on IT to build a report, self-service BI puts the tools directly in front of the people asking the question. A sales manager or finance analyst connects to the data, builds the view they need, and gets an answer without a ticket sitting in queue. It is changing how organizations expect employees to interact with data, and the pace of adoption shows no sign of slowing.
Understanding Self-Service Business Intelligence
Self-service business intelligence is an approach that allows non-technical employees to access, analyze, and visualize data on their own, without submitting a request to an IT or data engineering team. Instead of waiting weeks for a custom report, a marketing manager, finance analyst, or operations lead can connect to a dataset, build a dashboard, and answer a business question in hours.
Key features of self-service BI include:
Easy-to-use interfaces that allow users to work with data without technical expertise.
- Connections to multiple data sources such as CRM systems, ERP platforms, spreadsheets, and cloud databases.
- Drag-and-drop tools for creating reports and dashboards quickly.
- Organized and reliable datasets that make analysis easier and more accurate.
- Built-in sharing features that help teams collaborate and access insights.
The growing popularity of self-service BI comes from the need for faster access to information. In traditional reporting systems, employees often had to wait for IT teams to create reports whenever new questions arose. Self-service BI removes these delays by allowing users to access and analyze data on their own.
A Quick Bit of History
Self-service BI isn't a recent invention. Tools like early versions of Tableau and QlikView started pushing this idea in the mid-2000s, well before "self-service" became a common term in software marketing.
What's changed since then is the breadth of what's possible: Cloud data warehouses made it easier to connect tools directly to live data, and improvements in natural language processing added the ability to ask plain-English questions instead of building charts manually.
Allowing business users to examine data without the need for IT remains the fundamental concept. The tools simply became more adept at it.
How Self-Service BI Differs From Traditional BI
Traditional business intelligence is built around centralization. IT or a dedicated BI team owns the entire pipeline: data extraction, transformation, report design, and distribution. Business users consume fixed dashboards built by someone else, and any change to a metric or filter requires a formal request.
Self-service BI flips that structure. Business users still rely on IT to maintain the data infrastructure and security layer, but they no longer need IT to build every report or answer every ad hoc question.
The practical differences show up clearly:
- Speed: traditional BI report cycles can take days or weeks; self-service BI often delivers answers in minutes
- Ownership: traditional BI keeps report-building centralized with technical teams; self-service BI distributes that capability to business users
- Flexibility: traditional dashboards are static and request-based; self-service dashboards can be modified on the fly
- Skill requirement: traditional BI assumes SQL or technical query knowledge; self-service BI assumes basic data literacy and visual interface fluency
- Governance model: traditional BI enforces control through restricted access to tools; self-service BI enforces control through governed datasets and permissions, while keeping the tools open
Neither model is inherently superior. Many organizations run a hybrid, centralized data team manages pipelines and a trusted semantic layer, while business teams build and modify their own views on top of it.
Core Features of Self-Service BI Tools
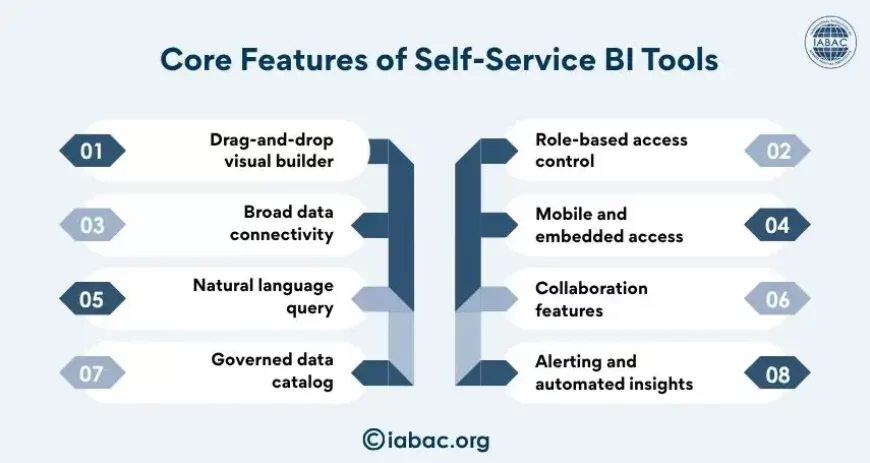
Not every analytics tool that claims to be "self-service" delivers the same depth. A handful of core features separate genuinely usable self-service BI platforms from ones that still require technical hand-holding.
- Drag-and-drop visual builder: lets users construct charts, graphs, and dashboards without writing code
- Broad data connectivity: native integrations with spreadsheets, cloud data warehouses, CRMs, and APIs, so users aren't stuck manually importing files
- Natural language query: allows a user to type a plain-language question and receive a chart or number in response
- Governed data catalog: a curated layer of trusted, pre-defined metrics and dimensions that prevents every user from building their own version of "revenue" or "active customer"
- Role-based access control: ensures sensitive data is only visible to people with the right permissions, even though the tool itself is open to many users
- Mobile and embedded access: dashboards that work on phones or get embedded directly into other applications, not just a separate analytics portal
- Collaboration features: commenting, sharing, scheduled report delivery, and version history
- Alerting and automated insights: notifications when a metric crosses a threshold, without a human needing to check the dashboard manually
These features work together. A drag-and-drop builder without a governed data catalog often produces inconsistent numbers across teams. A natural language query feature without role-based access control can expose sensitive data to the wrong audience.
Top 5 Self-Service BI Tools
A handful of platforms consistently lead in self-service capability, breadth of integrations, and usability for non-technical users.
- Microsoft Power BI: widely adopted because of its tight integration with Excel and the broader Microsoft 365 ecosystem. It offers strong natural language querying through Q&A visuals and is a common choice for organizations already standardized on Microsoft tools.
- Tableau: known for its visualization depth and flexibility. Tableau gives users granular control over how data gets displayed, making it a favorite among teams that need polished, presentation-ready dashboards.
- Qlik Sense: built around associative data modeling, which lets users click through data without losing context from previous selections. It's particularly strong for exploratory analysis across large, interconnected datasets.
- Looker (Google Cloud): built on a modeling layer called LookML, which lets data teams define metrics once and let business users build on top of consistent definitions. It's a strong fit for organizations prioritizing governance alongside self-service access.
- ThoughtSpot: distinguished by its search-driven interface, where users type questions in plain language and get instant visual answers powered by an underlying AI search engine.
Each tool takes a different approach to balancing flexibility with governance, so the right choice depends on existing infrastructure, technical maturity, and how tightly an organization wants to control metric definitions.
How AI Is Changing Self-Service BI
Artificial intelligence is reshaping what "self-service" actually means. Earlier self-service BI still required users to know which chart type to pick, which filters to apply, and how to structure a query. AI is removing several of those remaining friction points.
Natural language queries have matured significantly. Instead of selecting fields from a sidebar, users can type a question like "what were our top five products by margin last quarter?" and get a direct visual answer. Behind the scenes, large language models interpret intent and map it to the correct underlying data fields.
AI is also enabling automated insight generation. Rather than a user manually scanning a dashboard for anomalies, modern self-service tools can flag unusual spikes, drops, or correlations on their own and surface a plain-language explanation.
Predictive capabilities are becoming standard rather than an add-on. Forecasting future sales, churn risk, or inventory needs no longer requires a separate data science team; many self-service platforms now embed basic predictive models directly into the dashboard experience.
AI copilots embedded inside BI tools are also changing how reports get built in the first place. A user can describe what they want in a sentence, and the copilot drafts the visualization, which the user then refines manually. This narrows the gap between intent and output even further, making self-service BI accessible to an even broader range of employees.
Why Teams Are Adopting Self-Service BI
The push toward self-service BI is driven by a combination of organizational pressure and technical opportunity.
- IT bottlenecks became unsustainable: as data volume and the number of stakeholders requesting reports grew, centralized BI teams simply couldn't keep pace with demand.
- Cloud data warehouses lowered the barrier to entry: platforms like Snowflake, BigQuery, and Redshift made it far easier to centralize data in a structured, queryable format that self-service tools can plug into directly.
- Remote and distributed teams need direct access: when teams aren't sitting next to the analyst who builds reports, waiting on a request becomes even more impractical.
- Decision-making cycles compressed: competitive pressure means business teams need answers in hours, not weeks, particularly in fast-moving functions like marketing and sales operations.
- Data-driven culture became a stated priority: more organizations explicitly want employees making decisions based on data rather than intuition, and self-service BI is the practical mechanism that makes that possible at scale.
These drivers compound each other. A company with a strong cloud data foundation, distributed teams, and pressure to move fast has every incentive to push analytical capability outward rather than keeping it locked inside a single department.
Benefits of Self-Service BI for Modern Organizations
When implemented with proper governance, self-service BI delivers benefits across multiple dimensions of an organization.
- Faster time-to-insight: business questions get answered in the time it takes to build a dashboard, not the time it takes to file and wait on a request
- Reduced load on technical teams: data engineers and analysts can focus on infrastructure, data quality, and complex modeling instead of fielding routine report requests
- Stronger cross-functional collaboration: shared dashboards and common data definitions give different departments a consistent view of performance, reducing disputes over whose numbers are correct
- Improved agility: teams can adjust their analysis on the fly as business conditions change, rather than waiting for a static report to be rebuilt
- Better resource allocation: by removing repetitive reporting tasks from technical staff, organizations free up skilled analysts for higher-value work like predictive modeling and strategic analysis
- Broader data literacy: when more employees regularly interact with data tools, comfort and fluency with data analysis spreads naturally across the organization
- Scalability: self-service models scale more efficiently than centralized reporting teams, since growth in user demand doesn't require proportional growth in technical headcount
The combined effect is an organization where data becomes part of daily decision-making rather than a resource accessed only through formal requests.
Common Challenges in Self-Service BI
Self-service BI is not without friction, and organizations that skip the planning stage often run into predictable problems.
- Inconsistent metrics: without a governed data layer, different teams can define the same metric differently, leading to conflicting numbers in board meetings and planning sessions
- Data literacy gaps: not every employee has the analytical instincts to interpret a dashboard correctly, which can lead to flawed conclusions even when the underlying data is accurate
- Tool sprawl: as more teams adopt self-service platforms independently, organizations can end up with multiple overlapping tools, increasing licensing cost and reducing consistency
- Security and access control risks: broader access to data tools increases the surface area for accidental exposure of sensitive information if permissions aren't carefully managed
- Data quality issues: self-service tools amplify the impact of poor source data, since incorrect or outdated information now reaches far more end users directly
- Governance fatigue: maintaining a clean, well-documented data catalog requires ongoing effort, and that responsibility can get neglected once initial enthusiasm fades
- Overreliance on default visualizations: users without analytical training may misread charts or apply the wrong visualization type for the data they're presenting
Most of these challenges trace back to one root cause: treating self-service BI purely as a technology rollout rather than a combination of technology, governance, and training.
Self-service business intelligence works best when independence and structure coexist. Giving teams direct access to data accelerates decisions, but that access only produces reliable outcomes when paired with governed datasets, consistent metric definitions, and a baseline level of data literacy.
As self-service analytics becomes more common across organizations, professionals with business analytics certification can help bridge the gap between data and decision-making by applying analytical skills effectively. Together, technology, governance, and skilled talent enable analytics to scale across the business.