What Topics Should You Learn in Data Science First?
Start data science with essential topics like statistics python data analysis and machine learning to build strong foundations for real world problem solving.
If you have ever searched “How do I start Data Science?” you probably found a hundred different answers. One person says learn Python first. Another says start with statistics. Someone else tells you to jump into machine learning immediately. After reading all of that, many beginners feel more confused than before.
It often feels like walking into a huge library where every book is important, but nobody tells you which one to open first. You sit there staring at terms like algorithms, regression, Python, statistics, machine learning, big data, and visualization. Ten minutes later, your brain quietly says, “Maybe I should just watch cat videos instead.”
The good news is that you do not need to learn everything at once.
The smartest way to begin a Data Science journey is to learn the right topics in the right order. Once you follow a clear path, everything becomes much easier. In this blog, you will learn exactly what topics to study first, why they matter, and how they fit into your complete data scientist roadmap.
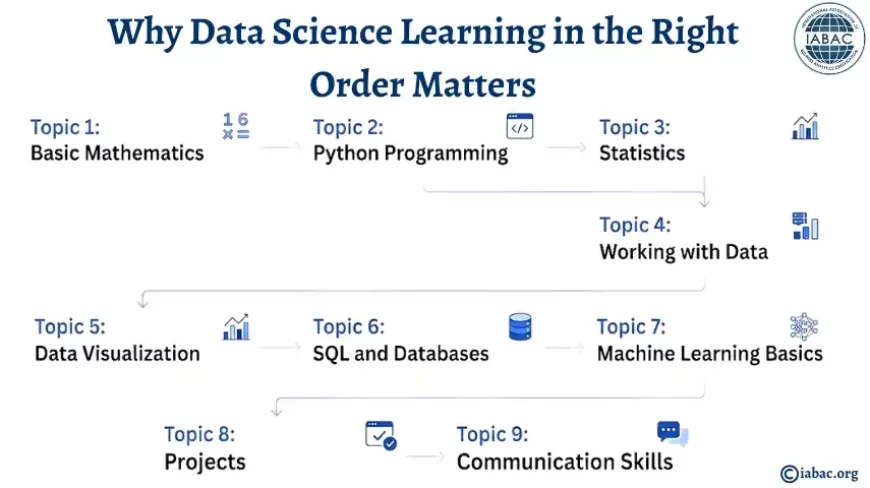
Why Learning in the Right Order Matters
Many people make the same mistake. They open a machine learning tutorial before learning basic programming or statistics. It is like trying to drive a race car before learning how to use the steering wheel.
Data Science is easier when you build step by step.
A simple learning path looks like this:
- Learn basic mathematics
- Learn Python programming
- Learn statistics
- Learn data handling
- Learn data visualization
- Learn machine learning
- Learn projects and real-world applications
Once you follow this order, every topic supports the next one.
Topic 1: Basic Mathematics
Many beginners worry when they hear the word mathematics. They imagine pages full of difficult equations and suddenly remember every painful math class from school.
Relax. You do not need advanced mathematics in the beginning.
You only need to understand a few important concepts:
- Percentages
- Averages
- Ratios
- Basic algebra
- Graphs
- Probability
For example, if a company had 100 customers last month and 120 customers this month, you can calculate the growth percentage.
The formula is:
Growth % = ((120 - 100) / 100) × 100 = 20%
A simple graph can also help you understand growth over time:
The relationship between months and customers can be shown like this:
Where:
- x = number of months
- y = number of customers
This means every month, the customer count increases steadily.
Understanding small formulas like this helps you understand larger ideas later in Data Science.
Topic 2: Python Programming
After mathematics, the next thing to learn is Python.
Python is the most popular language used in datascience because it is easy to read and simple to write.
For example, look at this:
print("Hello Data Science")
That is all it takes to write your first Python program.
Now compare that with some older programming languages that look like they were written by a robot who had too much coffee.
Python helps you:
- Read data
- Clean data
- Create charts
- Build machine learning models
The most important Python topics to learn first are:
- Variables
- Lists
- Loops
- Functions
- Conditions
- Dictionaries
For example:
marks = [70, 80, 90, 100]
average = sum(marks) / len(marks)
print(average)
This calculates the average score.
Learning these simple topics creates the foundation for everything else in your data science career.
Topic 3: Statistics
Statistics is one of the most important parts of Data Science.
If Python is the tool, statistics is the thinking behind it.
Statistics helps you answer questions like:
- What is the average?
- What is normal?
- Which value is unusual?
- Is this result trustworthy?
The first statistical topics you should learn are:
- Mean
- Median
- Mode
- Standard deviation
- Probability
For example, imagine five people earned these salaries:
20,000 | 22,000 | 23,000 | 24,000 | 1,00,000
The average salary becomes very high because of one large number.
That is why the median is sometimes more useful than the mean.
Understanding this is important because real-world science data is rarely perfect.
Another useful formula in statistics is the average:
This formula helps you find the average of any dataset.
Topic 4: Working with Data
Once you know Python and statistics, the next step is learning how to work with actual data.
Real data is messy.
You may find:
- Missing values
- Wrong spelling
- Duplicate rows
- Empty columns
A beginner usually imagines Data Science as exciting charts and predictions. Then they open a dataset and spend two hours fixing a column called “Customer_Age” because someone entered “banana” instead of a number.
Welcome to real life.
This topic is called data cleaning.
In Python, libraries like Pandas are used for this.
You should learn:
- Reading CSV files
- Removing duplicates
- Handling missing values
- Changing column names
- Filtering rows
Example:
import pandas as pd
data = pd.read_csv("sales.csv")
data = data.drop_duplicates()
This removes duplicate rows from the data.
Data cleaning is one of the most important skills in Data Science because clean data leads to better results.
Topic 5: Data Visualization
After cleaning data, you need to show it clearly.
Nobody wants to read 5,000 rows in a spreadsheet.
People understand charts faster than numbers.
That is why data visualization matters.
The first chart types you should learn are:
- Bar chart
- Line chart
- Pie chart
- Histogram
For example:
- Use a bar chart to compare product sales
- Use a line chart to show growth over time
- Use a pie chart to show percentage share
Imagine a business had these sales:
- January: 100
- February: 150
- March: 200
The line graph can be represented like this:
y=50x+100
This means sales are increasing every month.
Data visualization helps people quickly understand what is happening.
Without charts, even useful data can look confusing.
Topic 6: SQL and Databases
Many beginners skip SQL because they think Python is enough.
It is not.
Most companies store their information inside databases. SQL helps you get that information.
SQL is used to:
- Read data
- Filter records
- Join tables
- Find important information
For example:
SELECT name, salary
FROM employees
WHERE salary > 50000;
This finds employees with salaries above 50,000.
If you want a strong data scientist roadmap, learning SQL is necessary.
A good order is:
- Learn basic SQL queries
- Learn filtering
- Learn joins
- Learn group by
Once you know SQL, you can work with real company databases.
Topic 7: Machine Learning Basics
This is the topic most people want to learn first.
Machine learning sounds exciting because it allows computers to make predictions.
But remember: do not start here.
First, learn Python, statistics, and data cleaning.
Then, machine learning becomes much easier.
The first machine learning topics to learn are:
- Regression
- Classification
- Training data
- Testing data
- Accuracy
Example: A company wants to predict house prices.
The machine learning model may look like this:
Where:
- y = house price
- x = house size
- m = price change per square foot
- b = base value
This simple equation is the beginning of prediction models in Data Science.
Machine learning is not magic. It is simply finding patterns in data.
Topic 8: Projects
The biggest mistake beginners make is learning forever without building anything.
You can watch 500 videos, read 20 blogs, and still feel unprepared.
The moment you start a project, everything changes.
Projects help you:
- Practice what you learned
- Build confidence
- Create a portfolio
Some beginner project ideas are:
- Predict house prices
- Analyze movie ratings
- Study customer buying patterns
- Build a simple sales dashboard
A project does not have to be perfect.
Even a small project teaches you more than endless theory.
Topic 9: Communication Skills
Many people forget this topic, but it is very important.
A data scientist does not just work with numbers. They also explain results to other people.
Imagine you spend two weeks building a perfect model. Then somebody asks, “So what does this mean?” and you answer with twenty confusing formulas.
Everyone in the room quietly looks at each other and wishes the meeting would end.
That is why communication matters.
You should learn how to:
- Explain data simply
- Create clear reports
- Present charts
- Share useful ideas
The best data professionals are not always the people who know the most code. They are often the people who can explain complex ideas in a simple way.
Which Topic Should You Learn First?
If you are still confused, follow this order:
- Basic mathematics
- Python programming
- Statistics
- Data cleaning
- Data visualization
- SQL
- Machine learning
- Projects
- Communication
This is the best learning path for beginners.
How Long Does It Take to Learn?
A beginner can usually learn the basics of Data Science in 4 to 6 months with regular practice.
A simple schedule can look like this:
- Month 1: Mathematics and Python
- Month 2: Statistics and data cleaning
- Month 3: Visualization and SQL
- Month 4: Machine learning basics
- Month 5 and 6: Projects and practice
The more you practice, the faster you improve.
What About Data Science Jobs Salary?
Many people start learning because they want a better future and higher salary.
The good news is that Data Science is one of the most popular career choices today.
Average data science jobs salary worldwide:
|
Beginner: $60,000 to $90,000 per year |
|
Mid-level: $90,000 to $130,000 per year |
|
Senior level: $130,000+ per year |
In India:
|
Beginner: ₹4 to ₹10 LPA |
|
Experienced: ₹15 to ₹30+ LPA |
These numbers can increase even more with skills, experience, and certifications.
Why Data Science Certifications Help
Learning by yourself is helpful, but certifications give you proof of your skills.
Data Science Certifications help you:
- Learn in a structured order
- Build projects
- Improve confidence
- Show employers your knowledge
For beginners who want a clear path, the programs available at IABAC are useful because they cover Python, statistics, machine learning, and practical work.
You can explore them at: https://iabac.org/certifications
The IABAC website helps beginners understand which certification matches their level and career goal