


How Is a Business Analytics Course Structured
What you’ll learn in a Business Analytics course, from core data skills to real projects, so you can confidently make better business decisions.

A business analytics course helps learners understand how data supports planning, forecasting, and decision-making within different departments in an organization. Many professionals choose this path to grow stronger analytical skills, improve work performance, and prepare for data-based roles. Because companies depend heavily on accurate information, the demand for trained business analysts continues to grow across industries such as finance, retail, IT, supply chain, and healthcare.
Let’s find out how a business analytics course is structured, what subjects are covered, which tools are used, and how learners benefit from hands-on projects, Business Analytics certifications, and industry-ready skills. It also points out how IABAC certification adds credibility for those looking to advance in this field.
Why People Choose a Business Analytics Course
A course in business analytics supports learners who want to make decisions based on facts instead of assumptions. Many students and professionals choose this field because:
-
Data plays a major role in hiring, marketing, customer service, and operations.
-
Companies need analysts who understand business problems and can work with data tools.
-
Organizations want decision-makers who rely on measurable results.
-
Data-related roles offer strong career growth and stable earning potential.
Many students join this learning path because they see analytics becoming a basic part of how modern companies operate. Others enter because they feel their current roles don’t offer enough growth or because their industries are shifting toward more structured, data-focused work. This particular course gives them a sense of direction, structure, and clarity when upgrading skills.
Learners usually start this course to switch careers, gain confidence in handling data, or prepare for new responsibilities in their organization. Because the field develops so quickly, a structured and recognized training path helps learners stay successful during professional changes.
Who Can Take This Course?
The program is suitable for:
-
Students interested in building a data-focused career
-
Professionals looking to shift into analytics roles
-
Managers who depend on data for planning
-
Non-technical learners who want structured training
-
Individuals curious about how organizations measure performance
This course is flexible enough for beginners and working professionals alike. Most learners join without advanced technical knowledge. Basic comfort with numbers, logic, and spreadsheets is often enough to get started, and the structured modules ensure that learners gradually build stronger capabilities.
Common Duration and Eligibility
Although durations can differ, most courses in business analysis follow these timelines:
-
Short courses: 1–3 months
-
Professional certifications: 3–6 months
-
Advanced programs: 6–12 months
Eligibility usually includes:
-
Completion of schooling (10+2 or equivalent)
-
Basic computer skills
-
Interest in working with data and business cases
Professionals from finance, HR, marketing, operations, engineering, and IT commonly apply to jump into data-centered responsibilities. Since analytics is applied across industries, the course fits a wide range of career backgrounds.
Structure of a Business Analytics Course
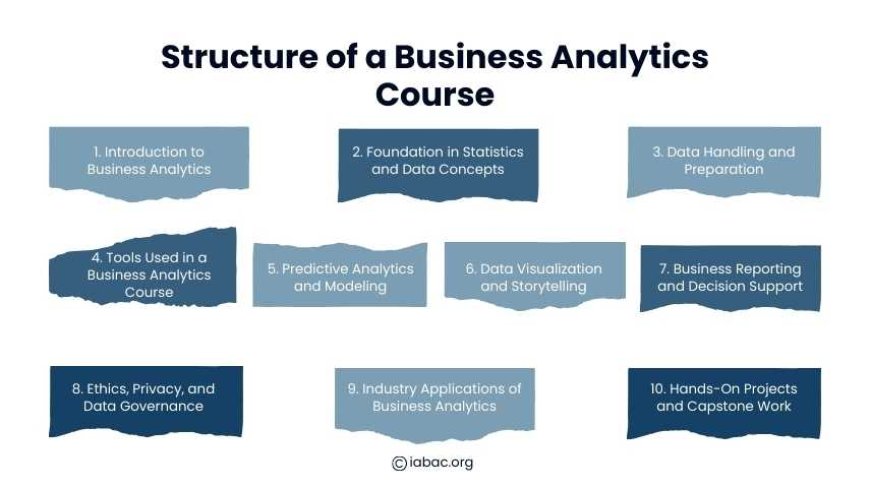
A well-designed business analytics course is divided into modules that progress from basic concepts to practical applications. Below is a detailed breakdown of the typical curriculum.
1. Introduction to Business Analytics
The course begins with an understanding of how organizations use data at different levels. This stage lays the foundation for the entire program.
Topics include:
-
What is business analytics?
-
Analytics vs. reporting
-
How data guides forecasting and planning
-
Common business challenges solved with analytics
-
Descriptive, diagnostic, predictive, and prescriptive analytics
This overview helps learners understand the role of analytics before exploring advanced technical topics.
2. Foundation in Statistics and Data Concepts
Since analytics relies on numbers and patterns, a business analysis program trains students in basic mathematical and statistical concepts.
Modules cover:
-
Mean, median, mode
-
Variance and standard deviation
-
Probability basics
-
Sampling techniques
-
Data distributions
-
Hypothesis testing
-
Correlation vs. causation
-
Basic principles of data cleaning
This foundation helps learners interpret information accurately and avoid common analytical mistakes.
3. Data Handling and Preparation
Before any model or dashboard is created, data must be cleaned and organized. This step ensures the accuracy of results.
Learners study:
-
Data collection methods
-
Organizing raw data
-
Removing duplicates and mistakes
-
Identifying outliers
-
Working with structured and unstructured data
-
Database concepts
-
Introduction to SQL for querying data
This module teaches learners the discipline and processes required to prepare reliable, high-quality datasets, one of the most valued skills in analytics roles.
4. Tools Used in a Business Analytics Course
A business analysis course introduces tools used across industries. These tools help analysts work faster, visualize trends, and model outcomes.
Common tools utilized by students include:
-
Excel for calculations, pivot tables, and dashboards
-
SQL for getting data from databases
-
Python or R for advanced analytics
-
Tableau or Power BI for visual dashboards
-
Microsoft tools for managing reports
-
Cloud-based platforms from providers like Google Cloud
Learners often practice with small datasets first and then move toward larger, more realistic datasets. By the time they complete the course, they become comfortable working with multiple tools.
5. Predictive Analytics and Modeling
This is a major component of a business analytics course, where learners understand how to use historical data to calculate future outcomes.
Concepts include:
-
Regression analysis
-
Forecasting methods
-
Classification and clustering
-
Understanding algorithms
-
Identifying seasonal patterns
-
Evaluating model performance
These skills help analysts support decisions related to sales growth, customer behavior, stock management, and financial planning.
6. Data Visualization and Storytelling
This program teaches learners how to transform complex data into visuals that are easy for teams to understand.
Learners practice:
-
Creating dashboards
-
Building charts and graphs
-
Communicating ideas clearly
-
Using Tableau or Power BI
-
Designing KPI dashboards for management
Data storytelling becomes an important skill because organizations depend on analysts to present findings that suggest immediate action.
7. Business Reporting and Decision Support
Reporting connects analytical findings to business decisions.
Important areas include:
-
Automated reporting
-
Writing analysis notes
-
Pointing out risks and opportunities
-
Connecting insights to goals
-
Presenting summaries to customers
-
Writing executive-level reports
This course trains learners to communicate information with clarity and accuracy, which helps organizations make informed decisions.
8. Ethics, Privacy, and Data Governance
Since business analytics deals with sensitive information, responsible usage is necessary.
Topics include:
-
Data governance
-
Ethical practices in analytics
-
Protecting personal information
-
Avoiding bias in analysis
-
Understanding privacy guidelines
This ensures learners understand the legal and ethical expectations of organizations.
9. Industry Applications of Business Analytics
Real-world examples help learners understand how analytics works across industries.
Examples include:
-
Retail: customer demand planning, market supply analysis, classification
-
Banking: credit scoring, fraud detection
-
HR: talent planning, engagement measures
-
Marketing: campaign performance, lead ranking
-
Healthcare: patient flow, diagnosis support
-
Manufacturing: process monitoring, quality tracking
This industry knowledge helps learners apply analytics skills in their chosen field.
10. Hands-On Projects and Capstone Work
Projects show practical understanding.
This program usually includes tasks like:
-
Sales prediction
-
Customer division
-
Churn prediction
-
Financial data dashboard
-
Stock planning
-
Website performance analysis
A final project connects all modules together, helping learners present real-world problem-solving skills to employers.
Career Paths After a Business Analytics Course
Completing this education program opens doors to roles such as
-
Business Analyst
-
Data Analyst
-
Reporting Analyst
-
Marketing Analyst
-
Financial Analyst
-
Operations Analyst
-
Supply Chain Analyst
-
BI Developer
These roles exist across tech, retail, banking, manufacturing, consulting, and public sector organizations.
Salary Expectations and Market Demand
Salary ranges differ across regions, but analytics roles offer strong earning potential. Skills such as Excel, SQL, Python, and dashboard creation affect salary growth. Professionals who can manage the entire analytics pipeline, from collecting data to presenting insights, usually receive better opportunities.
Because companies want to depend more on data-backed decisions, the demand for analytics talent continues to grow.
Improve Skills With IABAC Certification
Many learners choose to validate their training with globally trusted certifications.
IABAC certification helps by:
-
Offering strong, relevant assessments
-
Increasing credibility for both beginners and experienced professionals
-
Making candidates more known to employers
-
Adding recognized achievements to CVs and professional profiles
-
Supporting specialization paths like finance, marketing, or operations analytics
Combining a business analytics course with IABAC certification gives candidates a competitive advantage as organizations continuously seek skills they can trust.
A business analytics course provides a structured path for anyone who wants to understand data and support better decision-making. With a mix of foundational concepts, analytical tools, modelling techniques, dashboards, reporting, and hands-on projects, learners gain skills that apply to multiple industries. Pairing this learning with IABAC certification increases credibility and helps learners grow confidently toward data-focused careers.