


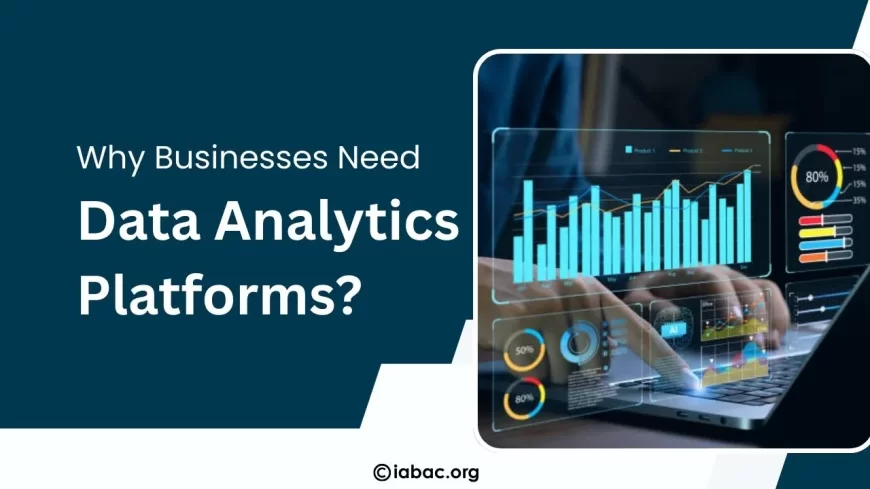
Why Do Businesses Need a Data Analytics Platform
See how a data analytics platform brings data together, improves decision-making, and helps businesses gain clarity, efficiency, and measurable results fast.
After working with data across different teams, tools, and business problems, one thing becomes clear very quickly: data itself isn’t the problem; how we manage and use it is.
Most organizations sit on mountains of information but still struggle to answer simple questions like what’s really driving performance or why decisions take so long. This is where a data analytics platform makes a real difference.
It brings scattered data together, adds structure, and turns everyday numbers into insights people can trust. When used well, it doesn’t just support decisions; it shapes how businesses think and move forward.
What Is a Data Analytics Platform?
A data analytics platform is an integrated ecosystem that collects, processes, analyzes, and visualizes data from multiple sources in a single structured environment.
Instead of juggling spreadsheets, disconnected dashboards, and manual reports, teams operate from one unified system where data updates automatically and insights are consistently defined.
In practice, it replaces:
-
Searching through siloed systems
-
Manually merging spreadsheets
-
Reconciling conflicting reports
With:
-
Real-time dashboards
-
Standardized metrics
-
Automated data flows
-
Clear, interactive visualizations
Modern platforms automate core tasks such as data refreshes, validation checks, and anomaly detection. As new information enters the system, insights evolve immediately. This reduces reporting delays and strengthens confidence in decision-making.
Why Do Organizations Invest in a Data Analytics Platform?
Organizations adopt analytics platforms because fragmented data slows growth and increases risk.
Global data creation continues to expand at an unprecedented scale. According to IDC, worldwide data volume is projected to reach 181 zettabytes. As complexity increases, traditional reporting methods struggle to keep up.
Businesses invest in structured analytics environments to achieve:
-
Faster decision-making through real-time insights
-
Unified visibility across departments
-
Stronger customer understanding through behavioral data
-
Operational efficiency via automation
-
Reduced reporting inconsistencies
-
Improved compliance and governance
Research from McKinsey indicates that data-driven organizations are significantly more likely to acquire customers and achieve profitability advantages.
Without a centralized platform, companies rely on delayed reports and partial visibility. With one, decisions are based on consistent, updated intelligence.
Different Types of Top Data Analytics Platforms
Data analytics platforms vary by purpose, maturity level, and business need. Below are major categories with leading solutions widely adopted across industries.
Business Intelligence & Visualization
These platforms focus on reporting, dashboards, and interactive visual storytelling.
-
Microsoft Power BI: Strong enterprise reporting capabilities and seamless integration with Microsoft ecosystems.
-
Tableau: Advanced visualization engine ideal for interactive storytelling and exploratory analysis.
-
Qlik Sense / QlikView: Self-service BI tools with associative data modeling.
-
Looker (Google Cloud): A robust data modeling layer enabling consistent enterprise metrics.
These tools are widely used for executive dashboards, departmental reporting, and performance tracking.
Cloud Data Warehousing & Architecture
These platforms handle large-scale storage and processing.
-
Snowflake – Cloud-native data warehouse offering scalability and performance optimization.
-
Databricks / Apache Spark – Designed for big data processing, fast distributed computing, and advanced analytics workloads.
They serve as the backbone for organizations managing high data volumes and complex transformations.
Product & Digital Analytics
Focused on customer behavior and digital interactions.
-
Google Analytics – Website tracking and traffic insights.
-
Amplitude – Product-led growth analytics and behavioral tracking.
-
Mixpanel – User journey analysis and retention metrics.
-
Fullstory – Digital experience monitoring and session insights.
These platforms help teams understand how users interact with digital products and services.
Data Preparation & Data Science
Used for advanced analytics and data modeling.
-
Alteryx – Data blending, preparation, and workflow automation.
-
Python (pandas, matplotlib) – Flexible environment for custom analysis and visualization.
-
SAS – Advanced statistical modeling and enterprise analytics.
They enable deeper statistical analysis and predictive modeling.
Embedded & Modern BI
These tools integrate analytics directly into business applications.
-
Sisense – AI-driven insights embedded into workflows.
-
ThoughtSpot – Search-driven analytics powered by natural language queries.
-
Domo – Cloud-native BI platform with real-time visibility.
These platforms make analytics accessible to non-technical users across operational systems.
Choosing the right category depends on data maturity, scalability requirements, governance policies, and business objectives.
What Are the Key Features of a Strong Data Analytics Platform?
High-performing platforms share common foundational capabilities.
Data Integration and Ingestion
They connect CRM systems, ERP tools, marketing platforms, financial databases, and application logs into one environment.
Data Processing and Management
Raw data is cleaned, standardized, validated, and governed. This includes removing duplicates, enforcing business rules, and aligning definitions.
Advanced Analytics and AI
Platforms support trend analysis, predictive modeling, anomaly detection, and machine learning workflows.
Visualization and Reporting
Interactive dashboards present insights clearly for technical and non-technical users.
Automation and Collaboration
Automated alerts, scheduled reports, and shared dashboards promote cross-team alignment.
These features transform analytics from passive reporting into an active decision-support system.
Data Analytics Platform Architecture
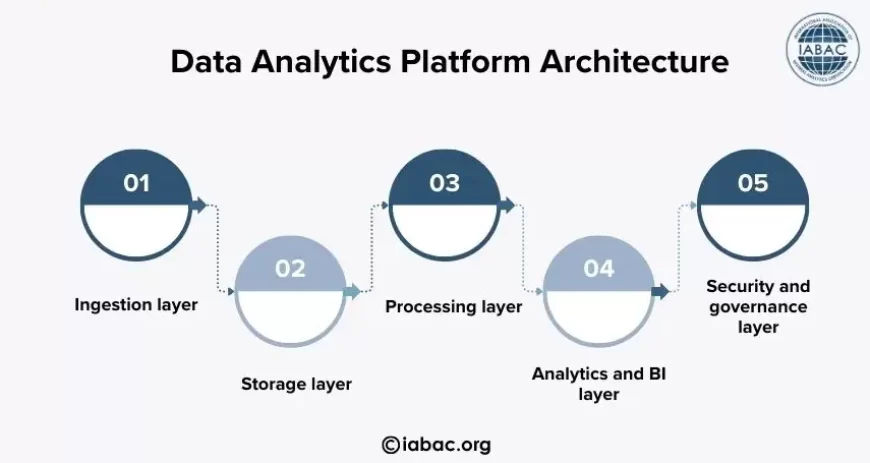
Behind intuitive dashboards lies a structured architecture designed for scale and security.
Most platforms follow layered architecture:
Ingestion Layer
Collects data from internal and external systems in real time or batches.
Storage Layer
Uses data warehouses, lakes, or cloud storage to manage structured and unstructured data.
Processing Layer
Transforms and models raw data into analytics-ready datasets.
Analytics and BI Layer
Enables dashboards, reports, queries, and model execution.
Security and Governance Layer
Implements access control, compliance policies, encryption, and audit tracking.
This layered design ensures scalability without constant infrastructure redesign.
How Do AI and Machine Learning Enhance Data Analytics Platforms?
AI capabilities are increasingly embedded within analytics platforms.
Instead of manually identifying patterns, AI surfaces insights automatically and continuously.
Key enhancements include:
-
Predictive analytics for forecasting outcomes
-
Anomaly detection to flag unusual activity
-
Natural language queries for simplified access
-
Automated insight generation
Industry projections suggest that the majority of modern analytics environments will incorporate AI-driven insight generation. This reduces reliance on technical expertise while expanding decision intelligence across teams.
What Happens Without a Data Analytics Platform?
Organizations operating without a centralized analytics system typically face:
Conflicting performance reports: Different teams rely on separate data sources and definitions, resulting in inconsistent metrics and reduced trust in reported outcomes.
Slow decision cycles: Leaders wait for manually prepared reports, delaying strategic actions and limiting the organization’s ability to respond quickly to changes.
Limited cross-department visibility: Siloed systems prevent departments from accessing shared insights, weakening collaboration and alignment across business functions.
Increased compliance risks: Poor data governance and lack of centralized control increase the chances of regulatory violations and audit complications.
Manual data reconciliation: Teams spend excessive time cleaning, merging, and validating data instead of focusing on analysis and strategic initiatives.
As markets accelerate, these inefficiencies compound. Delayed insights reduce agility, and inconsistent metrics erode trust in reporting systems.
How to Choose the Right Data Analytics Platform?
Selection should align with strategic objectives rather than tool popularity.
Key evaluation criteria include:
-
Scalability and performance capacity: The platform must handle growing data volumes, increasing users, and complex workloads without slowing down or requiring frequent infrastructure changes.
-
Integration compatibility: It should seamlessly connect with existing systems such as CRM, ERP, cloud storage, and third-party tools to ensure smooth data flow across the organization.
-
Security and compliance controls: Strong governance features, encryption, role-based access, and audit tracking are essential to protect sensitive data and meet regulatory requirements.
-
AI and automation readiness: The platform should support predictive analytics, machine learning integration, and automated workflows to enable forward-looking insights and operational efficiency.
-
Total cost of ownership: Beyond licensing fees, organizations must evaluate implementation, maintenance, training, and scaling costs to understand long-term financial impact.
-
Vendor roadmap and support: A reliable vendor should provide continuous innovation, product updates, technical assistance, and a clear development roadmap aligned with future business needs.
Organizations must assess current maturity while planning for future expansion.
How to Measure ROI from a Data Analytics Platform?
Return on investment should be tracked through measurable outcomes.
Common indicators include:
Reduced reporting cycle time: Automated data updates and centralized dashboards significantly shorten the time required to generate accurate business reports.
Improved forecast accuracy: Advanced analytics and predictive models enhance the precision of future projections using historical and real-time data.
Lower operational costs: Automation of data processing and reporting reduces manual effort, resource dependency, and infrastructure inefficiencies.
Higher customer retention: Behavioral insights enable personalized engagement strategies that strengthen customer relationships and loyalty.
Increased revenue efficiency: Data-driven pricing, targeting, and optimization strategies improve conversion rates and overall revenue performance.
Reduced compliance incidents: Centralized governance and audit tracking minimize regulatory risks and ensure adherence to data protection standards.
Clear performance benchmarks validate investment decisions and support continuous improvement.
Why Data Analytics Platforms Define Competitive Advantage
A data analytics platform is not simply a reporting tool. It becomes a strategic system that shapes how organizations operate.
It creates:
Clarity in complex environments: A unified analytics framework simplifies large and diverse datasets, helping organizations understand performance patterns without confusion or information overload.
Confidence in executive decisions: Reliable, real-time insights backed by validated data enable leaders to make strategic choices with greater assurance and reduced uncertainty.
Speed in operational execution: Immediate access to updated dashboards and automated alerts allows teams to act quickly and respond effectively to changing conditions.
Consistency in performance metrics: Standardized definitions and centralized reporting ensure all departments work with the same KPIs and trusted data sources.
Accountability across teams: Transparent access to shared metrics promotes responsibility, alignment, and measurable ownership of business outcomes.
As data volumes grow and competition intensifies, organizations that embed analytics into daily workflows build decision cultures grounded in evidence rather than assumption.
Professionals looking to strengthen their impact can validate their expertise through a Data Analytics Certification and contribute more effectively to data-driven careers.
Businesses that combine the right platform, strong governance, and skilled professionals create sustainable growth models. In environments where every decision influences revenue, efficiency, and customer trust, that advantage compounds quickly.