What Are Business Intelligence Systems and How Do They Work?
Understand how business intelligence systems turn raw data into actionable insights, improve decision-making, and support efficient, data-driven operations.
You open your dashboard on a Monday morning, expecting clarity but instead, you’re staring at scattered numbers from different tools that don’t quite connect. Sales data says one thing, marketing reports say another, and making a quick decision suddenly feels complicated.
This is a situation many businesses face when data exists but lacks structure. Having information is not the same as understanding it. That’s where business intelligence systems step in, helping you connect the dots, see the bigger picture, and make decisions with confidence instead of guesswork.
Let's break down what business intelligence systems are and how they actually work in real business scenarios.
What Is a Business Intelligence System?
A business intelligence system is an integrated set of tools and processes that transforms raw organizational data into actionable insights for strategic and operational decision-making.
Rather than leaving managers to wrestle with raw spreadsheets or disconnected databases, BI systems organize data from multiple sources into unified dashboards, reports, and visualizations that anyone in the organization can understand and act on.
The phrase "business intelligence" became popular in the 1990s, but the idea has grown a lot faster thanks to cloud computing, real-time data processing, and AI. BI systems today do more than just tell you what happened; they also help you figure out what might happen next.
It's important to know the difference between BI systems and simple reporting tools.
Your basic report says that your revenue for the third quarter was ₹4.2 crore.
A BI system shows you all of this on one screen: why it was ₹4.2 crore, which products drove it, which regions did poorly, how it compares to the forecast, and what is most likely to happen in Q4.
Key Components of a Business Intelligence System
BI systems are not just one piece of software. They are ecosystems made up of many interconnected parts, each of which has a specific job to do in the process of turning raw data into business insight.
Data Sources
ERP systems, CRMs, databases, spreadsheets, APIs, and third-party platforms that feed raw data into the BI pipeline.
ETL Pipeline
Extract, Transform, Load (ETL) - the process that pulls data from sources, cleans it, and loads it into a central repository.
Data Warehouse
A centralized, structured storage layer optimized for fast querying and historical analysis.
Analytics Engine
The computational layer that runs queries, models, and statistical calculations on the stored data.
Visualization Layer
Dashboards, charts, and interactive reports that present insights in human-readable formats.
Access & Governance
Role-based permissions, data lineage tracking, and compliance controls that keep data secure and trustworthy
These parts work together like a pipeline. Data comes in from one end, is cleaned and organized in the middle, and comes out as insight at the other. The reliability of your final reports depends directly on the quality of each layer.
How Does a Business Intelligence System Work?
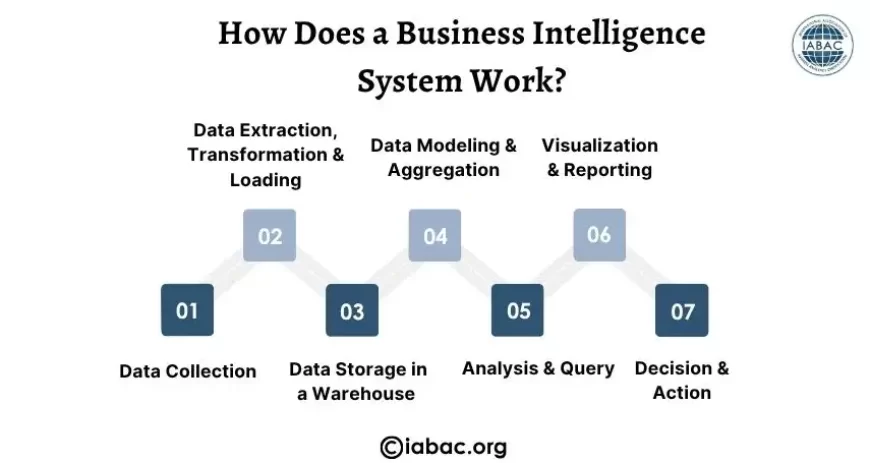
Understanding how a BI system operates end-to-end helps you appreciate why the results it delivers are so much more trustworthy than manually compiled reports. Here's the step-by-step process:
Data Collection
The BI system connects to all relevant data sources, your CRM, accounting software, e-commerce platform, marketing tools, and even external datasets like market indices or weather data. Modern BI platforms use connectors and APIs to automate this ingestion continuously.
Data Extraction, Transformation & Loading (ETL)
Raw data is rarely clean or consistent. The ETL process unifies formats, removes duplicates, fills gaps, and restructures data so that a "customer" in your CRM and a "buyer" in your billing system are recognized as the same entity. This is the most unglamorous and most critical step in the entire pipeline.
Data Storage in a Warehouse or Data Lake
Cleaned data is loaded into a centralized data warehouse (structured, schema-on-write) or data lake (flexible, schema-on-read). The warehouse is optimized for the kinds of analytical queries BI tools run, making retrieval fast even across billions of rows.
Data Modeling & Aggregation
Analysts or the BI system itself builds logical data models defining relationships, hierarchies, and metrics (like "monthly recurring revenue" or "customer acquisition cost") that business users will query. These models ensure everyone in the company is using the same definition for every metric.
Analysis & Query
Users run queries either directly in SQL, through a drag-and-drop interface, or increasingly by typing natural language questions like "Show me sales by region last quarter." The analytics engine processes these against the data model and returns results in milliseconds.
Visualization & Reporting
Results are rendered as interactive dashboards, trend charts, heat maps, tables, or automated reports. Alerts can be configured to notify stakeholders when a KPI crosses a threshold, for example, if cart abandonment spikes above 75% on a Tuesday afternoon.
Decision & Action
Business users from C-suite to frontline teams consume these insights and take action. The best BI setups close this loop by tracking whether decisions led to the expected outcomes, feeding that result back into the system.
Types of Business Intelligence Systems
Not all BI systems are built alike. They vary by deployment model, user sophistication, and the kind of analysis they support.
Traditional BI
Traditional BI systems are used in organizations that rely on structured processes and centralized control. These systems are typically managed by IT teams, ensuring that reporting remains consistent, secure, and aligned with compliance requirements. This makes them suitable for environments where stability and accuracy are critical.
This approach is commonly recognized for the following aspects:
-
Traditional BI systems focus on structured queries and controlled reporting environments
-
They are commonly used for compliance, governance, and operational consistency
Examples include SAP BusinessObjects and IBM Cognos in enterprise settings
Self-service BI systems
Self-service BI systems are designed to make data accessible to business users without requiring constant IT support. These systems allow professionals from different departments to interact with data, create reports, and generate insights independently, which improves responsiveness across teams.
This flexibility becomes clearer through the following characteristics:
-
Self-service BI enables non-technical users to analyze and visualize data easily
-
It reduces dependency on IT teams for everyday reporting needs
Popular tools include Tableau, Power BI, and Looker for interactive dashboards
Cloud-based BI systems
Cloud-based BI systems are gaining attention because of their scalability and flexibility. These systems operate on cloud platforms, allowing organizations to access data from anywhere while reducing the need for heavy infrastructure investment.
This model is widely adopted because it offers the following:
-
Cloud BI supports real-time data analysis with minimal infrastructure investment
-
It allows teams to collaborate across locations using centralized data access
Examples include Google Looker Studio, Domo, and Sisense platforms
Embedded BI systems
Embedded BI systems integrate analytics directly into applications or products. Instead of switching between tools, users can access insights within the platforms they already use, creating a more seamless experience.
This integration is especially valuable in situations where:
-
Embedded BI brings analytics directly into business applications and workflows
-
It improves user experience by providing insights within the existing interface
Tools such as Metabase, Luzmo, and Apache Superset support embedded analytics use cases
AI-augmented BI systems
AI-augmented BI systems represent a more advanced approach where artificial intelligence enhances data analysis. These systems help identify patterns, predict outcomes, and automate parts of decision-making, making them suitable for data-intensive environments.
This advancement is reflected in the following capabilities:
-
AI-augmented BI uses predictive analytics and machine learning for deeper insights
-
It helps identify anomalies and patterns that may not be visible manually
Platforms like ThoughtSpot, Microsoft Fabric, and Qlik support AI-driven analytics
The right kind depends on how technically advanced your team is, how much data you have, how much money you have, and whether you need real-time or batch reporting. A lot of companies use a mix of both.
For example, a cloud data warehouse might power both a self-service BI tool for analysts and a dashboard for customers.
Real-World Use Cases of Business Intelligence Systems
BI systems are used across every major function, supporting various applications in real-world business scenarios.
Sales & Revenue
Sales teams use BI to track pipeline health, monitor rep performance, identify deals at risk, and forecast quarterly revenue. Instead of waiting for a weekly spreadsheet from finance, a sales director can open a live dashboard on Monday morning and see exactly where deals stand.
Marketing
Marketers use campaign spending data and CRM conversions to figure out the real return on ad spend (ROAS) across all channels. BI systems let them move money from campaigns that aren't doing well to ones that are converting well in almost real time, instead of finding out about it weeks later in a follow-up.
Operations & Supply Chain
Manufacturers and logistics companies use BI to monitor inventory levels, track supplier lead times, identify delays on the production floor, and reduce waste. A single dashboard can surface that a component shortage is about to disrupt production in three weeks before it becomes a crisis.
Finance
Finance teams use automated BI-powered close processes instead of manual Excel consolidations that are prone to mistakes. They can quickly go from a combined Profit & Loss to the details of each transaction, something that used to take analysts days to do.
HR & People Analytics
HR teams use BI to analyze attrition patterns, monitor hiring pipeline velocity, track DEI metrics (Diversity, Equity, and Inclusion), and link engagement scores with business performance. This transforms HR from a reactive function into a proactive strategic partner.
Business Intelligence vs. Business Analytics: What's the Difference?
These terms are often used interchangeably, but they describe subtly different things.
Business intelligence is primarily descriptive and diagnostic: it answers "What happened?" and "Why did it happen?"
Business analytics is primarily predictive and prescriptive; it answers, "What will happen?" and "What should we do about it?"
BI tells you that customer churn increased by 12% last quarter and that it was concentrated in the mid-market segment.
Business analytics (or advanced BI with predictive models) tells you which customers are most likely to churn next quarter and recommends the retention offer most likely to keep them.
Modern BI platforms are increasingly blurring this line. Tools like ThoughtSpot and Microsoft Fabric now incorporate machine learning models directly into the analytics layer, delivering predictive insights alongside traditional descriptive reports.
If you're looking to build practical skills in this space, structured learning through a business analytics certification can help you apply these concepts in real-world scenarios and strengthen your ability to work with data-driven systems.
How to Choose the Right Business Intelligence System
With dozens of BI platforms on the market, choosing the right one requires clarity on your actual needs, not just the vendor's marketing claims. Here are the dimensions that matter most:
1. Data Sources and Integration
Check if the BI tool can easily connect with the systems you already use. A platform with many pre-built connectors can save a lot of time and effort. Make sure it supports your ERP, CRM, and any other important tools your business depends on.
2. User Experience and Self-Service
A BI system should not be limited only to the data team. The best platforms allow non-technical users to create dashboards and find answers on their own. During the trial, test this with real users to see how easy it is for them to use.
3. Scalability and Performance
Think about how the platform will perform as your data and users grow. Cloud-based systems usually handle growth better than on-premise ones. However, keep in mind that pricing may increase as usage grows over time.
4. Governance and Security
In industries like banking, healthcare, and pharma, data security is very important. Look for features like role-based access, audit logs, and data tracking. Also, check if the platform meets standards like SOC 2, ISO 27001, and local compliance requirements.
5. Total Cost of Ownership
License cost is just one part. You also need to consider setup, maintenance, training, and the time it takes to get results. Some tools may cost less upfront but take longer to deliver value.
As organizations continue to rely on structured data systems, understanding how business intelligence systems work starts to feel less like a technical skill and more like a practical advantage.
It helps you see what’s really happening behind the numbers and make sense of decisions that drive results.
Over time, this clarity builds confidence in handling data, asking the right questions, and contributing meaningfully to business outcomes.
As more teams depend on data in their daily work, being comfortable with business intelligence systems becomes a valuable step toward building stable and forward-moving careers.