


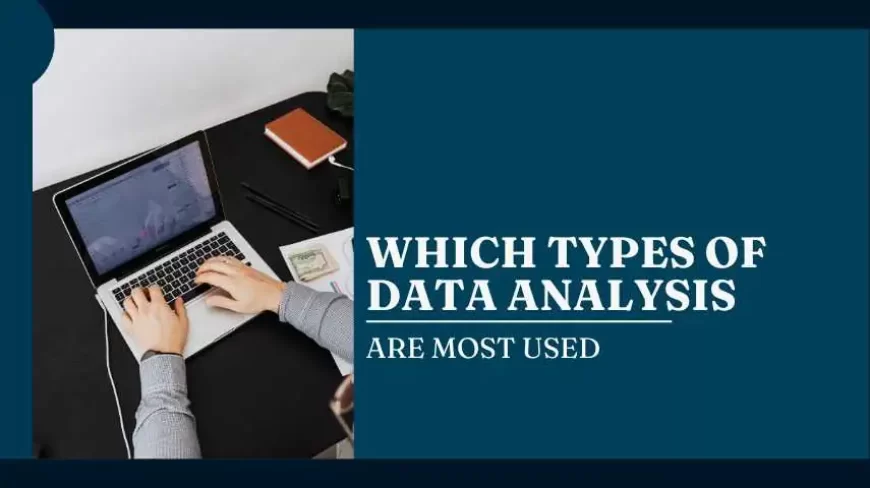
Which Types of Data Analysis Are Most Used
Understand the most used types of data analysis including descriptive diagnostic predictive and prescriptive techniques that support data driven decisions.
Data is everywhere. It sits quietly inside Excel sheets, business dashboards, HR systems, hospital records, banking apps, e-commerce platforms, and even inside your fitness tracker. But raw data alone is like a kitchen full of ingredients without a recipe. The magic happens when someone knows how to analyze it.
That is where types of data analysis come in.
If you are planning a career in analytics, preparing for interviews, or exploring professional programs like Data Analytics Certifications, one big question often appears:
Which types of data analysis are most used by data analysts?
And even more interesting — why are some types of data analysis more used than others?
Let’s break this down clearly, practically, and honestly.
What Is Data Analysis?
Data analysis is the process of examining data to find patterns, trends, answers, and useful insights that help organizations make decisions.
Companies do not analyze data just for fun. They analyze it to:
- Increase revenue
- Reduce costs
- Improve customer satisfaction
- Improve hiring decisions
- Predict risks
- Improve operations
From startups to global enterprises, everyone depends on analytics.
The 4 Main Types of Data Analysis
In real-world business environments, analytics work is typically divided into four major categories. These are widely recognized across industries and form the foundation of analytics education and certification programs.
The four major types of data analysis are:
- Descriptive Analysis
- Diagnostic Analysis
- Predictive Analysis
- Prescriptive Analysis
These four categories represent increasing levels of complexity and business value.
Let’s understand each one clearly.

1. Descriptive Data Analysis – The Most Widely Used
Descriptive analysis answers a simple but powerful question:
What happened?
This type of analysis summarizes historical data. It does not try to predict the future or recommend actions. It simply presents facts clearly.
Examples include:
- Monthly revenue reports
- Website traffic dashboards
- Customer satisfaction scores
- Employee attendance summaries
- Sales performance by region
- Annual profit margins
Descriptive analysis typically uses:
- Averages (mean, median, mode)
- Percentages
- Growth rates
- Key Performance Indicators (KPIs)
- Year-over-Year comparisons
- Charts and dashboards
Why Descriptive Analysis Is Used the Most
There are several reasons:
- Every organization requires reporting.
- It is essential for tracking performance.
- It forms the base for all other analysis types.
- It requires fewer advanced technical skills compared to predictive modeling.
Industry observations suggest that approximately 60–70% of analytics work across organizations involves descriptive reporting. This includes business intelligence dashboards, financial summaries, HR metrics, and operational tracking.
Without descriptive analysis, businesses would not even know their current performance.
This is why it remains the most used type of data analysis globally.
2. Diagnostic Data Analysis – Understanding the Cause
Once an organization understands what happened, the next logical question is:
Why did it happen?
Diagnostic analysis investigates relationships and root causes.
For example:
- Sales declined by 12% last quarter. Why?
- Employee attrition increased in one department. Why?
- Website bounce rate increased. Why?
Diagnostic analysis uses techniques such as:
- Data segmentation
- Correlation analysis
- Drill-down reporting
- Comparative analysis
- Root cause analysis
It requires deeper investigation than descriptive analysis but still remains practical and widely used.
Business Use Cases
Marketing teams use diagnostic analysis to understand campaign performance.
HR teams use it to examine employee turnover patterns.
Finance teams use it to analyze cost increases.
Operations teams use it to identify inefficiencies.
Diagnostic analysis builds on descriptive insights. It moves beyond reporting and begins explaining trends.
3. Predictive Data Analysis – Estimating Future Outcomes
Predictive analysis answers:
What is likely to happen next?
This type of analysis uses statistical models and historical data to forecast future events.
Examples:
- Predicting customer churn probability
- Forecasting next quarter revenue
- Predicting loan default risk
- Estimating employee resignation likelihood
- Forecasting product demand
Common techniques include:
- Regression analysis
- Time series forecasting
- Machine learning algorithms
- Classification models
- Statistical probability models
Predictive models often measure accuracy using metrics such as:
- Accuracy percentage
- Precision and recall
- R-squared value
- Mean Absolute Error (MAE)
- Root Mean Square Error (RMSE)
For instance, a churn prediction model with 85% accuracy can significantly improve retention strategies.
Why Predictive Analysis Is Less Used Than Descriptive
Although highly valuable, predictive analysis requires:
- Clean and structured historical data
- Advanced statistical knowledge
- Programming skills (Python, R)
- Machine learning understanding
- Technical infrastructure
Many organizations are still developing these capabilities. As a result, predictive analysis is growing rapidly but is not yet as universally used as descriptive reporting.
4. Prescriptive Data Analysis – Recommending Actions
Prescriptive analysis answers:
What should we do about it?
This is the most advanced category. It not only predicts outcomes but also suggests optimal decisions.
Examples:
- Adjust pricing strategy based on demand prediction
- Optimize delivery routes to reduce cost
- Recommend marketing budget allocation
- Suggest retention strategies for high-risk employees
Prescriptive analysis often combines:
- Predictive modeling
- Optimization algorithms
- Simulation models
- Decision trees
- Advanced analytics systems
It is powerful but less common because it requires strong expertise, advanced systems, and strategic integration into decision-making processes.
Which Types of Data Analysis Are Most Used by Data Analysts?
Now let’s answer clearly.
Based on industry practices:
- Descriptive Analysis – Most Used
- Diagnostic Analysis – Second Most Used
- Predictive Analysis – Growing Fast
- Prescriptive Analysis – Least Used but Advanced
Most entry-level and mid-level data analysts work heavily with descriptive and diagnostic analysis.
Predictive and prescriptive work is more common among data scientists and senior analytics professionals.
Why Are Some Types of Data Analysis More Used Than Others?
This is a very important question.
Let’s break it logically.
1. Skill Requirements
Descriptive analysis requires basic tools like Excel and SQL.
Predictive and prescriptive analysis require:
- Statistics knowledge
- Programming skills
- Machine learning models
Since not every organization has advanced experts, simpler analysis types dominate.
2. Business Needs
Most companies first need reports and dashboards.
They need to know:
- Revenue
- Profit
- Performance
- Hiring data
- Customer feedback
Daily reporting is mandatory.
Advanced forecasting is important, but not every company needs it daily.
3. Data Availability
Predictive models need clean, structured, historical data.
Many organizations still struggle with:
- Incomplete data
- Poor data quality
- Unstructured systems
So they stick to descriptive reporting.
4. Cost and Infrastructure
Advanced analytics requires:
- Cloud computing
- Data warehouses
- Data engineers
- Machine learning platforms
Small and medium companies may not invest heavily in this.
5. Decision-Making Culture
Some organizations rely on experience and intuition.
Others rely fully on data.
Companies with strong data culture use predictive and prescriptive models more often.
Industry Example: HR Analytics
Let’s connect this with a practical example.
HR departments use multiple types of data analysis.
Descriptive:
- Number of hires
- Attrition rate
- Gender diversity ratio
Diagnostic:
- Why is attrition higher in one department?
Predictive:
- Which employees are likely to resign?
Prescriptive:
- What retention strategy should HR implement?
Professionals who specialize in this area often pursue programs like Certified HR Analytics Professional certifications to build expertise.
Organizations that focus on structured learning paths through recognized Data Analytics Certifications programs often show stronger analytics maturity.
That is one reason why structured training platforms like IABAC emphasize practical learning.
You can explore more about professional certification programs through iabac.org, where industry-relevant analytics certifications are structured around real-world application.
Tools Used Across Different Types of Data Analysis
Here is a simplified comparison:
|
Type of Data Analysis |
Commonly Used Tools / Techniques |
|
Descriptive |
Excel SQL Power BI Tableau |
|
Diagnostic |
SQL Python R Statistical Analysis |
|
Predictive |
Python (scikit-learn) R Machine Learning Models Regression |
|
Prescriptive |
Optimization Tools Advanced ML Models Simulation Systems |
Most analysts begin with Excel and SQL before moving into Python and machine learning.
Metrics Commonly Used in Data Analysis
Some frequently used business metrics include:
- Customer Lifetime Value (CLV)
- Conversion Rate
- Churn Rate
- Net Promoter Score (NPS)
- Attrition Rate
- Revenue Growth %
- Cost Per Acquisition (CPA)
- Return on Investment (ROI)
Understanding these metrics is more important than just learning tools.
Career Perspective: What Should You Learn First?
If you are entering the analytics field:
Start with:
- Descriptive analysis
- SQL
- Excel
- Dashboard tools
Then move to:
- Statistical analysis
- Python or R
- Predictive modeling
Then advance into:
- Machine learning
- Optimization
- Advanced business analytics
Professional certifications in analytics provide structured progression from foundational to advanced topics.
The Truth About Analytics Careers
Many beginners think analytics is all about fancy AI models.
But reality is different.
Companies urgently need people who can:
- Clean messy data
- Create clear dashboards
- Explain insights in simple language
- Translate numbers into decisions
It is not about complex formulas all the time.
It is about clarity.
A good data analyst is someone who can sit in a meeting and explain why sales dropped without making everyone confused.
That skill is rare.
Future of Data Analysis
The demand for analytics professionals continues to grow globally.
Reports from industry research firms show that data-driven decision-making increases productivity by 5–6% on average in organizations that adopt analytics effectively.
As businesses collect more data, predictive and prescriptive analysis will grow.
But descriptive analysis will never disappear.
Because every prediction still needs a report.
So, which types of data analysis are most used?
Descriptive analysis leads the way.
Diagnostic analysis follows closely.
Predictive analysis is expanding rapidly.
Prescriptive analysis represents the advanced level.
Some types are more used because they are easier, more practical, and required daily in business operations. Others are used less because they demand advanced skills, infrastructure, and strategic maturity. For anyone serious about building a strong analytics career, understanding all four types of data analysis is essential. Structured Data Analytics Certifications and specialized programs like Certified HR Analytics Professional can help bridge the gap between theory and real-world practice.
Analytics is not just about numbers.
It is about asking the right questions.
It is about solving problems.
And sometimes, it is about staring at a spreadsheet for two hours before realizing the filter was wrong.
But when insights finally appear, it feels powerful.
That is the beauty of data analysis.
And that is why it continues to be one of the most impactful career paths today.