


Limitations of Data Analytics: What the Numbers Can't Tell You
Understand the limits of data analytics, why numbers can mislead, miss context, and still need human judgment for smarter, more balanced business decisions.
We live in a world obsessed with data. Every click, every purchase, every scroll gets tracked. Businesses spend millions building dashboards, hiring analysts, and running reports, all in the hope that the numbers will tell them exactly what to do next.
And sometimes, they do.
But here's what most data enthusiasts won't tell you: the numbers can be wrong, incomplete, or just flat-out misleading. Not because someone made a mistake, but because data has real limits that even the best tools can't fix.
Understanding the limitations of data analytics isn't about being anti-data. It's about being smarter with the data you have. Let's break it down in plain language.
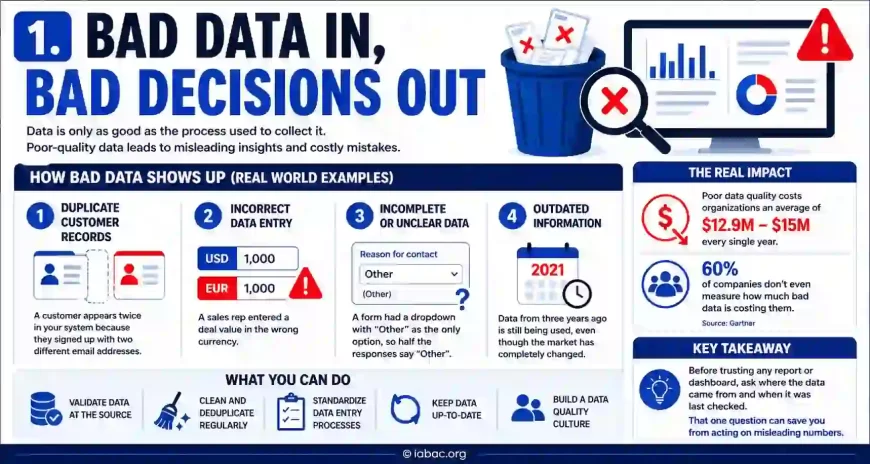
1. Bad Data In, Bad Decisions Out
Let's start with the most basic problem. Data is only as good as the process used to collect it.
Think about it this way: if you're baking a cake and you use expired ingredients, it doesn't matter how good your oven is or how carefully you follow the recipe. The result will still be bad.
The same goes for analytics.
Here's what bad data looks like in the real world:
-
A customer appears twice in your system because they signed up with two different email addresses
-
A sales rep entered a deal value in the wrong currency
-
A form had a dropdown with "Other" as the only option, so half the responses say "Other"
-
Data from three years ago is still being used, even though the market has completely changed
These aren't rare edge cases. They happen in almost every organization. And when you run analysis on top of messy data, the output looks clean and confident — even though it's built on shaky ground.
According to studies, poor data quality costs organizations an average of $12.9 million to $15 million every single year, and 60% of companies don't even measure how much bad data is costing them.
One simple habit that helps: Before trusting any report or dashboard, ask where the data came from and when it was last checked. That one question can save you from acting on numbers that don't mean what you think they mean.
2. Data Lives in the Past But Decisions Live in the Present
Every dataset you work with is a record of something that already happened. That's just the nature of data; it documents the past.
The problem is that business leaders often use past data to make future decisions, without stopping to ask whether the past is still relevant.
Here's a simple example. A restaurant chain looks at five years of sales data and notices their busiest days are always Friday and Saturday nights. So they staff up heavily on weekends. Makes sense, right?
Then a new office complex opens nearby, and suddenly lunch on weekdays becomes their peak time. But because the team is still relying on old patterns, they're understaffed at lunch and overstaffed on weekends for months before anyone notices.
This is one of the most common data analytics challenges in business, using historical information as though it's a crystal ball.
What you should remember:
-
Trends can shift quickly, especially in competitive markets
-
External events — economic changes, new competitors, shifts in customer habits — can make old data irrelevant almost overnight
-
Always ask: "Is the world today similar enough to the world when this data was collected?"
3. Just Because Two Things Move Together Doesn't Mean One Causes the Other
This is one of those concepts that sounds obvious when you first hear it, but gets ignored constantly in real life.
Correlation means two things tend to happen at the same time. Causation means one thing actually causes the other. These are very different — and confusing them leads to some genuinely terrible decisions.
Here's a fun example to make it click:
Every summer, ice cream sales go up. Every summer, the number of people who drown also goes up. If you just looked at the numbers, you'd see a strong correlation between ice cream and drowning.
Should we ban ice cream to save lives? Obviously not. The real cause is the third factor — hot weather — which leads to more swimming and more ice cream eating.
Now here's how this plays out in a business setting:
A company notices that customers who follow them on social media tend to spend more money. Leadership gets excited and pours budget into growing their social following. But the reality? People who follow brands on social media were already more loyal customers to begin with. The social media following didn't create loyalty — loyalty created the social media following.
The result: wasted budget and a confused team wondering why more followers didn't translate to more revenue.
Before acting on any interesting pattern in your data, slow down and ask why it might exist. Better yet, run a small test to see if changing one thing actually changes the other.
4. Data Carries the Biases of the People Who Created It
Here's something a little uncomfortable to sit with: data is not neutral.
It's collected by people, organized by people, and analyzed by people. And people have blind spots, assumptions, and biases — even when they're trying their best to be objective.
Some common ways bias sneaks into analytics:
-
You only measure what's easy to measure. Customer satisfaction surveys reach people who open their emails. But what about the customers who quietly left without saying a word? Their experience never shows up in the data.
-
Old patterns get baked in. If a company trains a hiring tool on ten years of past hiring decisions, and those past decisions skewed toward one type of candidate, the tool will keep favoring that same profile — even if no one intended that.
-
People find what they're looking for. If a manager believes a new sales strategy is working, they'll often unconsciously focus on the numbers that support that belief and downplay the ones that don't.
This doesn't mean you should stop using data. It means you should regularly ask: Who collected this? Who might be missing from this dataset? And what assumptions are baked into this analysis?
5. Numbers Don't Tell You Why, and "Why" Is Usually What Matters
Data is great at showing you what happened. It's not so great at explaining why.
Say your e-commerce site sees a sudden 30% drop in sales over two weeks. The data will show you that clearly. It might even show you which product categories dropped the most, or which traffic source dried up.
But it won't tell you:
-
Did a competitor run a big sale?
-
Did a review go viral for the wrong reasons?
-
Did a shipping issue frustrate customers?
-
Did your checkout page break on a certain device?
To answer the "why," you need to actually talk to people — customers, support staff, sales reps. You need to read reviews, check forums, and use some good old-fashioned common sense.
Data analytics in business works best when it's paired with human insight, not used as a replacement for it. Think of the data as the flashlight — it shows you where to look. But you still have to look.
6. Privacy Rules Are Changing What You're Allowed to Track
This one is growing in importance fast. Governments around the world are tightening the rules on how businesses collect and use personal data.
GDPR in Europe, CCPA in California, and a wave of similar laws in other regions have made it much harder to track users the way companies used to. Third-party cookies, which advertisers relied on heavily for years, are being phased out. Health data, financial data, and location data all come with strict rules now.
What this means practically:
-
Some data you used to rely on is no longer available.
-
Some data you currently use might become unavailable soon.
-
Building your entire strategy on third-party data is risky.
The smarter move is to focus on first-party data — information your customers actually give you directly, willingly, and with full understanding. It's less of it, but it's more trustworthy and more sustainable.
7. Too Much Faith in Data Can Crush Good Instincts
Here's something counterintuitive: being too data-driven can actually hurt your business.
When every single decision needs a spreadsheet to justify it, a few things start to happen.
New ideas get killed before they start. By definition, a truly new idea has no historical data behind it. If your culture demands data proof before trying anything, you'll only ever do versions of what you've already done.
Experienced people stop speaking up. A veteran employee who has been in the industry for twenty years might sense something is wrong long before any dashboard shows it. But if they can't point to a chart, their instinct gets dismissed. That's a real loss.
Some of the biggest business decisions in history, launching entirely new product categories, entering new markets, disrupting old industries, happened because someone trusted their read of the situation, not because a model told them to.
Data should inform your judgment. It shouldn't replace it.
8. Small Samples Can Make Small Noise Look Like a Big Signal
This one catches a lot of people out, especially in smaller businesses or early-stage teams.
When you don't have a lot of data, it's very easy to spot a pattern that isn't really there. A few good weeks of sales look like a trend. A handful of negative reviews looks like a crisis. Two months of growth looks like proof that a strategy is working.
Here's a quick way to think about it:
Flip a coin ten times. You might get seven heads. Does that mean the coin is biased? No, ten flips just isn't enough to know. Flip it a thousand times, and you'll get closer to 50/50.
The same logic applies to business data. If your A/B test ran for four days and had 150 visitors, you don't have enough data to declare a winner — even if one version looks better. Acting on that is like flipping the coin ten times and making a life decision based on the result.
Before acting on any analysis, ask: Is there actually enough data here to trust this conclusion?
So What Should You Actually Do?
None of this means you should stop using data. It means you should use it with your eyes open.
A few simple principles to carry with you:
-
Check your data quality before you analyze anything. Dirty data leads to confident, wrong answers.
-
Ask "why" before you act on a correlation. Don't let the numbers do your thinking.
-
Pair data with conversations. Talk to customers, staff, and stakeholders. Numbers give you the what — people give you the why.
-
Stay humble about forecasts. The future doesn't always look like the past.
-
Trust expertise alongside data. Experienced judgment has value that no model can fully capture.
Data analytics is one of the most powerful tools available to modern businesses. But it's a tool, not a truth machine.
The limitations of data analytics don't make it useless. They place blind trust in data. The businesses that thrive aren't the ones with the most data — they're the ones who know how to ask the right questions, spot the gaps, and use human judgment to fill them.
Numbers are a starting point. Never let them be the last word. And if you're looking to build a stronger foundation in analytics — one that teaches you both the power and the limits of data — the Data Analytics Certification is a great place to start.