


What is Finance Analytics and How It Works
Learn what Finance Analytics is, how it works, key tools, benefits, and practical uses. Learn to make smarter, data-driven financial decisions easily.

Finance analytics are changing the way businesses understand their financial performance and make strategic choices. I'll explain what it is, how it works, and why it's become so important for today's business professionals. We will discuss how data can provide insights that improve predictions, reduce risks, and increase profitability, using current data analysis techniques and practical financial practices as references.
It will help you understand how financial analytics enables more intelligent, data-driven financial decisions in the currently growing digital economy.
What Is Finance Analytics?
It (sometimes called financial analytics) is the process of collecting, processing and analyzing financial and related business data to help organisations make better decisions. It’s the structured examination of your business’s financial data to evaluate its health and enhance performance.”
Simply put: instead of relying purely on gut-feeling or traditional accounting reports, it uses data, statistics, tools and visualisations to ask and answer questions like:
-
What happened financially in the past year?
-
Why did our costs go up (or profits go down)?
-
What might happen in the next quarter if we keep current trends?
-
Where can we reduce risk or improve return?
It includes using data analysis and statistical approaches to get insights, make informed financial decisions, and optimize financial operations within businesses.
So, if you imagine a company that needs to determine whether to launch a new product, expand into a new market, or borrow money for expansion, it provides the data-driven knowledge to help make those decisions.
Why Finance Analytics Matters
Understanding why it is important helps you see its value. Here are several key reasons:
Informed decision-making
Businesses move from decisions based on intuition to decisions grounded in data. They can examine trends, compare scenarios, and pick options more likely to succeed.
Performance measurement & benchmarking
Analytics enables companies to compare how they’re doing against their goals, against peers, and to identify strengths and weaknesses.
Risk management
By analysing financial data and related non-financial data (e.g., market, operational data), organisations can spot risks early, whether credit risk, liquidity risk, or operational financial risk.
Forecasting and future planning
It helps forecast future performance, model what-ifs and plan for growth or contraction. This gives businesses more control over their financial destiny.
Operational efficiency
Data analytics can help uncover inefficiencies, for example, cost leaks, poor asset utilisation, redundant processes and help optimise finances.
Enhanced financial visibility
Instead of waiting for end-of-month reports, more dynamic analytics gives near real-time views of financial health, helping organisations react faster.
In short, it brings the power of data to the finances of an organisation, making them smarter, more proactive and better managed.
The Key Components of Finance Analytics
What goes into this? Let’s break down the key building blocks:
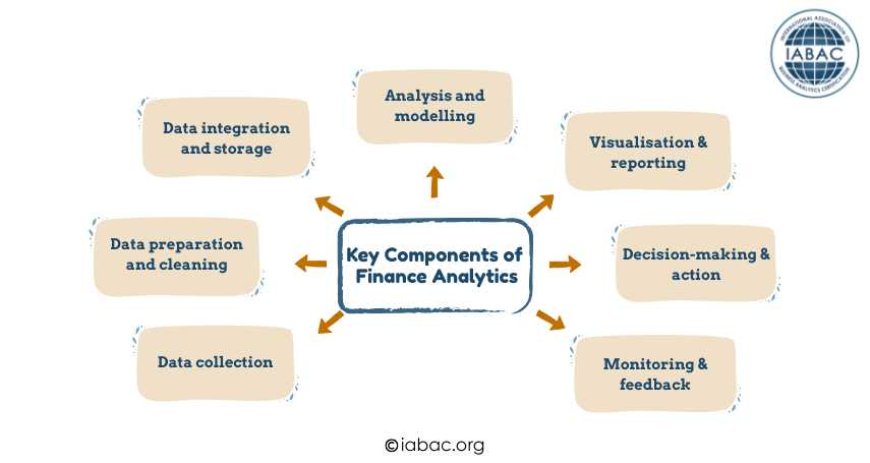
1. Data collection
First, you need data. This includes financial statements (income statement, balance sheet, cash flow), budgets, forecasts, transaction data, costs, revenues, assets, and liabilities. It may also include non-financial data like operational metrics, market data, customer behaviour, etc.
2. Data preparation and cleaning
Raw data often has errors, missing values, and inconsistencies. Data must be cleansed, transformed, standardized and combined (from various sources) so that it is ready for analysis.
3. Data integration and storage
This often means putting together data in a data warehouse or data lake, integrating across systems (e.g., ERP, CRM, finance systems) so you have a unified view.
4. Analysis and modelling
Here’s where you use statistical techniques, machine learning, business intelligence tools, dashboards, and visualizations. You may perform descriptive analytics (what happened), diagnostic (why it happened), predictive (what will happen) and prescriptive (what should we do).
5. Visualization & reporting
The insights need to be communicated via dashboards, charts, and visual reports, so non-technical stakeholders (e.g., finance managers, business leaders) can understand and act.
6. Decision-making & action
Insights alone are not enough; they must lead to action. The finance team and business leaders must use those insights to make decisions: invest, cut costs, allocate resources, adjust pricing, etc.
7. Monitoring & feedback
Once decisions are made, analytics continues: track outcomes, compare actuals vs forecasts, update models, improve processes. This feedback loop makes the analytics more valuable over time.
How Finance Analytics Works in Practice
Let's take a simple, step-by-step look at how it works within a company:
-
Define objectives: The company defines what it wants to accomplish, such as "We want to reduce the cost of goods sold (COGS) by 5%," or "Predict cash flow for the next 12 months with 90% accuracy."
-
Data collection: Collect past financial data (revenues, costs, and profit margins) as well as market and operational data that may have an impact on finances.
-
Prepare the data: Clear and modify the data. For example, you can correct missing values, change currencies, align accounting periods, and remove duplicates.
-
Integrate data: Bring in data from other systems (sales, procurement, HR, and production) to observe how activities impact finances.
-
Analyse: Use appropriate techniques:
-
Descriptive: “Last quarter we spent 12% more on raw materials.”
-
Diagnostic: “Why? Because supplier costs increased by 9%, and usage increased by 13%.”
-
Predictive: “If costs keep increasing, our profit margin will shrink to X.”
-
Prescriptive: “We should switch supplier or renegotiate contract, or reduce usage by Y%.”
-
Visualization and reporting: Create dashboards for decision-makers, such as a cash-flow heatmap, spending breakdown, and scenario comparisons.
-
Decision and implementation: Based on these insights, leaders decide on a course of action, such as modifying price, reducing costs, adjusting product mix, or removing underperforming segments.
-
Monitor and iterate: After implementation, track the results. Did the cost drop? Has performance improved? Feed this back into the next cycle.
A practical example: It is used by retail businesses to analyze inventory prices, sales margins, supplier terms, and returns data. They learn that one product line has a high return (cost hit) but a poor margin. Analytics show that discontinuing that line will decrease costs while increasing profit margins. They visualize the outcome and decide to reallocate shelf space to a more profitable item. Over the next quarter, they will monitor and enhance the results.
Key Tools & Technologies in Finance Analytics
It uses a range of tools. Here are a few of the commonly used ones:
-
Spreadsheet software (Excel, Google Sheets): Still widely used for smaller-scale analytics.
-
Business Intelligence (BI) tools: Tableau, Power BI, Qlik, etc, for interactive dashboards and visualisations.
-
Data warehouses/data lakes: For integrating large data sets from various sources.
-
Statistical & machine learning tools: R, Python (pandas, numpy, scikit-learn), sometimes specialised tools for financial modeling.
-
Automated analytics and AI: Increasingly, finance analytics uses predictive models, automation of data pipelines, and anomaly detection via machine learning.
-
Dashboards with real-time/near-real-time data: Allowing leaders to react faster.
The combination of finance domain knowledge + data analytics skills + modern tooling is what makes a successful initiative.
Types or Categories of Finance Analytics
It's useful to understand the many "types" or layers of analytics, as each has a unique function and value. They are usually referred to as:
-
Descriptive analytics: What happened? E.g., revenue dropped by 5% last quarter.
-
Diagnostic analytics: Why did it happen? E.g., because a supplier cost rose, or sales per unit fell.
-
Predictive analytics: What might happen? E.g., forecasting cash flow, revenue, risk, and cost.
-
Prescriptive analytics: What should we do about it? E.g., switch supplier, change product mix, budget differently. Some advanced systems can even automate suggestions.
Understanding these layers allows you to arrange your analytics efforts – you may begin with descriptive and diagnostic, then progress to predictive and prescriptive as maturity increases.
How You Can Get Started
If you're a learner or early-career professional looking to start or advance in this, here are some steps you can take:
-
Strengthen finance fundamentals: Understand financial statements, cash flow, budgeting, cost management, and financial ratios.
-
Learn analytics basics: Statistics, data visualisation, and basic machine learning concepts.
-
Learn to use the following tools: Power BI or Tableau for dashboards, Excel (advanced), and possibly Python/R for more complex tasks.
-
Develop domain knowledge: Understand how business functions (sales, operations, and supply chain) influence finance so you can connect data to business outcomes.
-
Work on practical projects: Practical experience improves understanding—current datasets, case studies, internships.
-
Stay updated: The field changes quickly. Keep a watch out for new tools, analytical techniques, and financial technology advancements.
-
Communicate insights: Analytics is only effective if you can communicate your findings to stakeholders; focus on data storytelling.
Following these steps will put you in a better position to make valuable contributions in these roles.
These are changing how businesses manage their finances and make strategic decisions. Companies can transition from standard reporting to proactive, insight-driven decision-making by utilizing data analysis, visualization, and predictive modeling. When used properly, it can assist in finding cost-saving possibilities, predict future trends, manage risks, and improve the overall success of the business.
Consider getting the Finance Analytics Certification to create a solid foundation and prove your skills in this rapidly growing field. This certification provides professionals with the necessary abilities to succeed in informed financial decision-making.