


Top Data Analyst Skills To Get Hired in 2026
Struggling to land a data analyst role in 2026? These 8 in-demand skills are exactly what hiring managers look for—time to start learning.

Hundreds of people apply for data analyst roles every single day, but only a handful actually get hired. The difference? It's not talent. It's not a fancy degree. It's having the right skills, built in the right order.
Data analyst jobs are growing fast in 2026, and companies are actively looking for candidates who can hit the ground running. But knowing where to start feels overwhelming without a clear direction.
This guide breaks down the 8 core skills every data analyst needs in 2026, and exactly how to build them the right way.
What's Changed in 2026
The data analyst role has shifted significantly. Routine tasks like generating standard reports, and pulling basic dashboards are increasingly handled by automated tools and AI assistants.
What companies actually need now are analysts who can:
-
Ask the right questions before touching any data
-
Handle messy, incomplete, real-world datasets
-
Translate findings into decisions, not just charts
-
Communicate clearly to people who've never opened a spreadsheet
That's the profile of getting hired. Build toward that, not just toward a list of tools.
The global data analytics market is on track to hit $104.39 billion by end of 2026, growing at an annual rate of 21.5%.
The Skills Ranked by What Gets Tested First
1. SQL: The Gateway Skill
Every analyst interview has SQL in it somewhere. No exceptions.
SQL is how analysts talk to databases. Nearly all business data, transactions, customers, operations, and marketing live in relational databases. Without SQL, there's no way to reach it at any meaningful scale.
What to learn:
-
Selecting, filtering, and sorting data — the absolute basics
-
Aggregating with GROUP BY, COUNT, SUM, and AVG
-
Joining multiple tables together — spend extra time here, this is where most candidates struggle
-
Subqueries and CTEs for more complex logic
-
Window functions like RANK, LAG, and LEAD — these signal real competence to hiring managers
How to practice: Don't just watch tutorials. Open a free SQL environment, grab a public dataset, and answer a real question using queries. Repeat this until writing feels automatic.
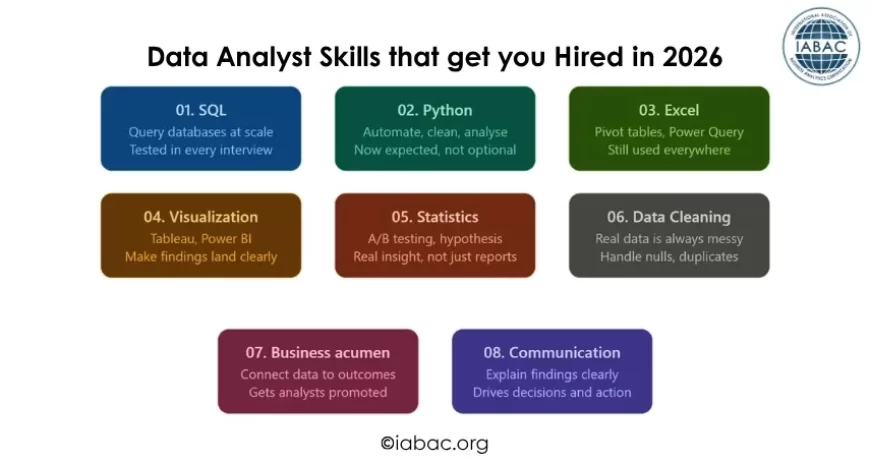
2. Python: Now Expected, Not Optional
Python has crossed from "nice to have" into standard expectation at most companies hiring analysts in 2026.
The reason is simple: Python handles the work that Excel can't. Cleaning hundreds of thousands of messy rows, automating weekly reports, running statistical models, and building repeatable analysis pipelines. These are tasks analysts are increasingly expected to manage themselves.
What to focus on:
|
Library |
What It Does |
|
Pandas |
Loading, filtering, transforming, and merging data |
|
NumPy |
Numerical calculations and array work |
|
Matplotlib / Seaborn |
Building clear, readable charts |
|
Jupyter Notebooks |
Where analysis gets written and documented |
How to practice: Pick a topic, such as genuinely interesting local city data, sports stats, or personal finance trends, find an open dataset and try to answer a real question using only Python. One afternoon of that teaches more than ten hours of guided tutorials.
3. Excel: Still Running More Businesses Than People Admit
Dismissing Excel as outdated is a mistake that costs job offers.
Finance teams model scenarios in it. Operations managers track weekly performance through it. Smaller companies run their entire data operation on it. Even organizations with sophisticated data infrastructure use Excel for quick analysis and shared reporting.
Skills that impress hiring managers:
-
Pivot tables for fast dataset summarization.
-
XLOOKUP for reliable cross-sheet data retrieval.
-
Power Query for pulling and transforming data from external sources.
-
SUMIF, COUNTIFS, and nested IF formulas for business reporting logic.
-
Basic macros for automating repetitive manual tasks.
An analyst comfortable in SQL, Python, and Excel is far more versatile than one who only knows one of them — and hiring managers notice that versatility immediately.
4. Data Visualization: Make Findings Impossible to Ignore
A technically perfect analysis that nobody understands has zero business value.
Data visualization bridges the gap between what the data shows and what decision-makers actually do with it. Charts and dashboards aren't decoration — they're the delivery mechanism for the entire analysis.
Tools to know:
-
Tableau: industry standard for interactive dashboards, widely required in job postings
-
Power BI: deeply embedded in Microsoft environments, huge in enterprise companies
-
Looker Studio: free, useful for Google Analytics and marketing data
-
Plotly / Seaborn: for visualization inside Python workflows
What actually makes a visualization good:
-
The right chart type for the message trends on line charts, comparisons on bar charts.
-
A single clear takeaway visible within three seconds of looking at the screen.
-
Designed for the audience, not for the analyst who built it.
-
No clutter, no unnecessary color, no chart types chosen for aesthetics over clarity.
Underneath the tools, data storytelling: Every piece of analysis should answer three questions. What does the data show? Why does that matter to the business? What should happen next? Analysts who frame their work around those three points consistently get listened to.
5. Statistics: Where Insight Actually Comes From
This is the skill most self-taught analysts skip. It shows — immediately — in interviews.
Without statistical grounding, numbers get taken at face value. Random fluctuations get reported as meaningful trends. Recommendations get made on patterns that disappear the moment someone digs one layer deeper.
Concepts with direct real-world use:
-
Mean, median, and standard deviation: understanding what a dataset actually looks like before drawing conclusions
-
Hypothesis testing: Is this result meaningful, or could it have happened by chance?
-
A/B testing: did this product change, price adjustment, or campaign actually cause an improvement?
-
Correlation vs. causation the most important distinction in all of practical data work
-
Confidence intervals communicate how reliable a finding actually is
Real example: A company sees a 5% lift in conversions after a homepage redesign. An analyst without statistics reports it as a win. An analyst with statistics runs a significance test, finds the sample was too small to conclude, and prevents a costly full rollout based on noise. That second analyst is worth significantly more to any company.
6. Data Cleaning: The Unglamorous Reality
No tutorial prepares anyone for what real business data actually looks like.
The same customer appears under three different names. Dates stored as text. Revenue figures that include returns in some months and not others. Entire columns are blank because an integration broke six months ago, and nobody noticed.
This isn't the exception; it's the norm. And cleaning it properly before analysis starts is what determines whether the final output is trustworthy or dangerously wrong.
Common cleaning tasks analysts handle:
-
Removing duplicate records that inflate totals.
-
Standardizing inconsistent entries in categorical columns.
-
Handling null values: fill, flag, or drop based on context.
-
Reformatting dates and numbers stored as the wrong data type.
-
Merging datasets from different sources while reconciling conflicts.
Candidates who show they've dealt with genuinely messy data in their portfolio work immediately stand out from those whose projects were built on clean, pre-formatted tutorial inputs.
7. Business Acumen: What Separates Good Analysts from Great Ones
Every skill above is technical. This one isn't, and over a full career, it might matter more than all of them.
An analyst with business understanding doesn't wait to be told what to look at. They can walk into a meeting, hear what the team is worried about, and immediately know which data matters and what question to ask. That ability to connect data work directly to business outcomes is what gets analysts invited into strategy conversations.
How it shows up in practice:
-
Knowing which metrics leadership actually cares about and why
-
Framing findings around decisions, not just descriptions
-
Understanding what different departments are trying to accomplish and what pressures they work under
-
Asking "what decision does this analysis need to support?" before writing a single query
How to develop it: Sit in cross-functional meetings when possible. Read company reports and industry news. Talk to people in sales, marketing, and operations about their real challenges. Every conversation builds context that makes the data make more sense.
8. Communication: The Skill That Drives Promotions
Some analysts produce brilliant work that nobody acts on, while others produce solid work that shapes decisions consistently. The difference is almost always communication.
What strong analyst communication looks like:
-
Leading with the finding — not the methodology
-
Explaining results in plain language to people without technical backgrounds
-
Answering "so what?" before anyone has to ask it
-
Adjusting depth and detail based on who's in the room
-
Being honest when the data doesn't support a conclusion
One habit that builds this fast: After finishing any analysis, write three sentences. What does the data show? Why does it matter? What should happen next? No jargon. No assumptions. Just the clearest possible version of the finding. Repeat consistently, and the improvement over a few months is significant.
Skills at a Glance
|
Skill |
Why It Matters |
Priority |
|
SQL |
Required in nearly every analyst interview |
Must-Have |
|
Python |
Handles work Excel can't — now expected |
Must-Have |
|
Excel |
Still used everywhere, tests versatility |
Must-Have |
|
Data Visualization |
Translates analysis into action |
Must-Have |
|
Statistics |
Separates real insight from reporting |
Must-Have |
|
Data Cleaning |
Real data is never clean — deal with it |
High |
|
Business Acumen |
Connects data to outcomes |
High |
|
Communication |
Determines if findings get acted on |
High |
A Realistic Timeline
Months 1–2: SQL daily. Don't move until the joints feel natural.
Months 3–4: Python fundamentals. Finish with one real published project.
Months 5–6: Tableau or Power BI. Build one complete dashboard for a real question.
Months 7–8: Statistics applied inside existing projects — not studied in isolation.
Month 9+: Apply while continuing to build. Waiting to feel ready adds months with no real benefit.
The analysts getting hired aren't the ones with the longest tool lists. They're the ones who can take a real business problem, find the right data, clean it properly, pull out what matters, and explain it clearly enough that something actually changes because of it.
Build toward that. Everything here points directly at it.
Start with SQL. Stay consistent. Use real data. Show the work.
And if credibility is needed to back those skills up, the IABAC Data Analyst Certification is worth looking at. It's a globally recognized credential that gives the skill set a professional stamp hiring managers actually respect.