


Business Analytics Syllabus: Modules, Tools, and Career Scope
Confused about business analytics courses? Explore a complete syllabus, tools, and career paths to choose the right program and build real job-ready skills.
Most people searching for a business analytics course already know they want to work with data. What they do not know is whether the course they are looking at will get them there. I have seen this confusion up close to professionals with years of experience in finance, marketing, or operations who cannot tell whether the curriculum is rigorous or surface-level.
This post breaks that down. I will walk you through the complete business analytics course structure: what each module covers, which tools you will learn, and how it maps to actual job roles.
Why Does the Syllabus Matters More than the Certificate?
A certification is only as strong as what you learned to earn it. I have interviewed candidates who held data certifications but could not explain the difference between correlation and causation. The certificate was real. The learning was not.
Before enrolling anywhere, you need to evaluate the business analytics curriculum not the brochure, not the testimonials. The modules. The tools. The depth of each topic.
Step: 1 Data Analysis Fundamentals and Statistics
This module covers descriptive statistics (mean, median, variance, standard deviation), probability distributions, hypothesis testing, and regression analysis. These are not optional. They are the difference between a person who reads a dashboard and a person who knows why a number moved.
I have seen analysts skip this module, jump straight to tools, and then spend years producing outputs they cannot defend in a boardroom. Learn math first. The tools make sense after that.
A strong business analytics course outline will include both Excel and at least one programming language Python or R in this module. Excel for business-facing work; Python or R for reproducibility and scale.
Step: 2 SQL and Data Cleaning
SQL is non-negotiable. Almost every analytics role regardless of industry requires you to pull and join data from a relational database. If the business analytics training syllabus you are looking at skips SQL, walk away.
Data cleaning and preprocessing deserve equal attention. In practice, analysts spend 60 to 70 percent of their time on this. You will deal with missing values, duplicate records, inconsistent formats, and outliers before you ever touch a visualization tool.
Step: 3 Power BI, Tableau, and Dashboard Design
Data visualization is where analysis meets communication. A well-designed dashboard can shift a business decision in a single meeting. A poorly designed one gets ignored.
The MBA business analytics syllabus at most reputed programs includes both Power BI and Tableau. These are not interchangeable; Power BI integrates deeply with the Microsoft ecosystem; Tableau is preferred in consulting and tech environments. Learning both gives you options.
Beyond tool proficiency, this module should teach you design principles when to use a bar chart versus a scatter plot, how to reduce cognitive load, and how to tell a story with data. Dashboard creation is a communication skill, not just a technical one.
Step: 4 Predictive Modeling and ML Foundations
This is where the business analytics course structure starts to separate strong programs from weak ones. Predictive analytics is the engine behind demand forecasting, customer churn prediction, credit scoring, and supply chain optimization.
You do not need to become a data scientist. But you do need to understand linear regression, logistic regression, decision trees, and basic clustering. These are foundational. Without them, you are limited to describing what happened, not anticipating what will happen.
Machine learning basics in this context means supervised vs. unsupervised learning, model evaluation (accuracy, precision, recall, AUC), and overfitting. You are not building neural networks, you are learning enough to collaborate with data scientists and evaluate their outputs critically.
Step: 5 Marketing, Financial, and Operations Analytics
Generic analytics knowledge will not differentiate you in a hiring decision. Domain-specific modules will. A good business analytics program syllabus includes:
Marketing analytics: customer segmentation, campaign attribution, cohort analysis, and customer lifetime value (CLV). If you come from a marketing background, this module makes your existing experience immediately actionable with data.
Financial analytics: variance analysis, financial modelling, risk analysis, and KPI tracking. Finance professionals who add these skills move from reporting to forecasting, which is a fundamentally different and better-paid role.
Operations analytics: process optimization, inventory modelling, logistics data analysis, and quality control metrics. Manufacturing and supply chain companies have significant demand for analysts who understand both the business context and the data behind it.
Step: 6 Big Data Fundamentals and Cloud Platforms
The business analytics subjects list is incomplete without at least an introduction to big data. You do not need to be a Hadoop engineer. But understanding distributed computing concepts, data lakes versus data warehouses, and the role of cloud platforms (AWS, Azure, GCP) is expected in most mid-to-senior analytics roles.
The online business analytics syllabus at IABAC-aligned programs includes hands-on exposure to these platforms, not just conceptual overviews.There is a meaningful difference between knowing that Spark processes large datasets and actually writing a Spark query.
Step: 7 Capstone Projects and Applied Work
Theory without application does not transfer. The final component of any credible business analytics certification syllabus should be a capstone project using real or realistic datasets.
I have personally evaluated dozens of analytics portfolios. The candidates who stood out were not those with the longest list of courses. They were the ones who could show a project end-to-end: problem statement, data sourcing, cleaning, analysis, visualization, and a recommendation backed by data.
Look for programs that include industry case studies not generic datasets. A retail churn prediction project, a financial risk model, or a marketing attribution analysis is far more valuable on a portfolio than a textbook exercise.
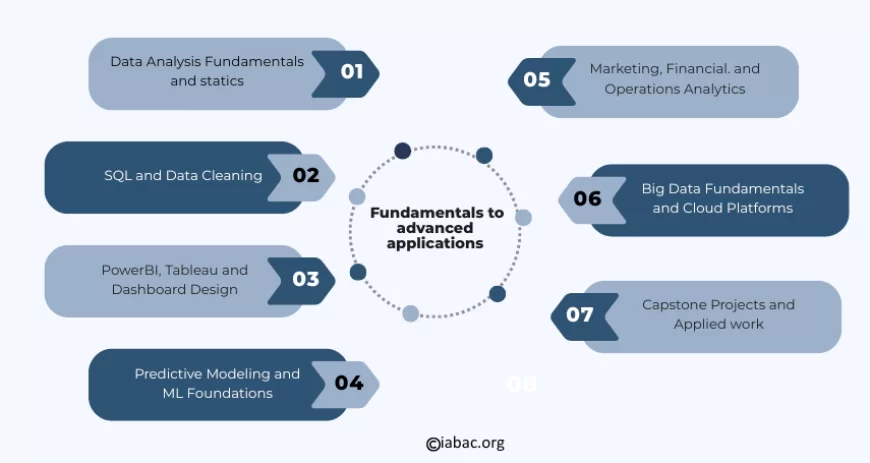
Table: Full Syllabus at a Glance
|
Module |
Key Topics |
Core Tools |
|
Data & Statistics Foundations |
Descriptive stats, hypothesis testing, regression |
Excel, Python |
|
Data Management |
SQL querying, data cleaning, preprocessing |
SQL, Python (Pandas) |
|
Visualization & BI |
Dashboard design, data storytelling, reporting |
Power BI, Tableau |
|
Predictive Analytics |
Regression, Classification, Model Evaluation |
Python (Scikit-learn), R |
|
Domain Analytics |
Marketing, financial, operations analytics |
Excel, Python, Power BI |
|
Big Data & Cloud |
Data lakes, distributed computing, cloud basics |
AWS/Azure, Spark |
|
Capstone Projects |
End-to-end real-world analytics projects |
Full stack (all tools) |
Career Scope After Completing this Syllabus:
The roles this syllabus prepares you for are specific. I want to be direct with you: completing a business analytics program does not automatically make you a data scientist. But it does make you a strong candidate for:
-
Business Analyst: The most direct role. You bridge business problems and data solutions. High demand across BFSI, e-commerce, and healthcare.
-
Data Analyst: More technical, more Python and SQL-heavy. If you put in the work on modules 1 through 4, this is achievable within 12 months.
-
Marketing / Financial Analyst: Domain-specific roles where your existing background plus analytics skills creates immediate value. These transitions are faster for professionals already working in those sectors.
-
BI Developer / Reporting Analyst: Power BI and Tableau expertise alone opens significant opportunities in mid-size and enterprise companies building internal analytics functions.
They finish the syllabus but never build a portfolio. The certificate proves you completed a course. The portfolio proves you can do the work. Recruiters can tell the difference in minutes.
After completing the program, take one domain problem from your current industry and solve it end-to-end using what you learned. Document it. Publish it on GitHub or Kaggle. That one project will do more for your career than three additional certifications.